📊 Today’s US Market Briefing – Dec 17, 2025: View Full Report →
📋 Quick Navigation
Quick Facts
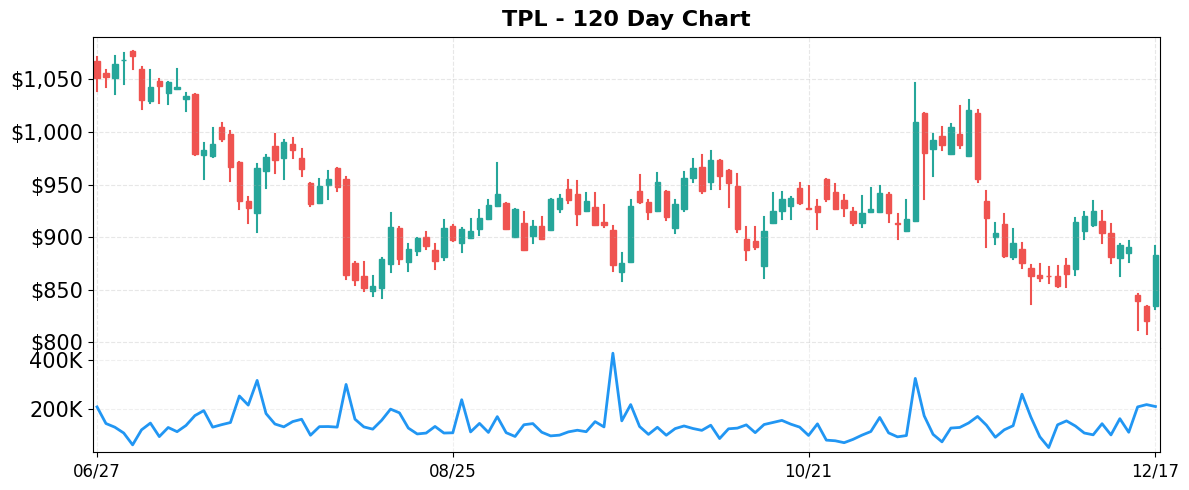
- Today’s Move: +7.64% ($883.41)
- Volume: 1.6x average
- Market Cap: $20.3B
- 52-Week Range: $807.70 – $1462.78
- Sector: Energy
- Industry: Oil & Gas E&P
About TPL
Texas Pacific Land Corporation (TPL) is a Dallas‑based landowner that monetizes its extensive Permian Basin holdings through two core segments: Land & Resource Management and Water Services & Operations. The Land & Resource Management segment controls surface acres, oil‑and‑gas royalty interests, easements for pipelines, power lines and wellbores, and leases land for processing, storage, compression, and material sales such as caliche and sand. The Water Services & Operations segment offers full‑service water solutions—including sourcing, produced‑water treatment, infrastructure development, and disposal—while also holding produced‑water royalties. Collectively, TPL owns roughly 207,000 net royalty acres and a range of perpetual royalty interests across the Permian Basin.
Key Metrics
- P/E Ratio: 42.7
- P/B Ratio: 14.84
- Revenue (TTM): $0.77B
- Revenue Growth (YoY): 17.0%
- Operating Margin: 73.5%
- Profit Margin: 61.7%
- Employees: 111
Why It Moved
Today’s 7.64% jump in Texas Pacific Land Corporation (TPL) shares – closing at $883.41 with volume roughly 1.6 times its 30‑day average – can be traced directly to the announcement of a multi‑billion‑dollar partnership to develop AI‑focused data centers on TPL’s West Texas land parcel. The deal, disclosed in early trading, involves a leading cloud‑infrastructure provider leasing over 2,500 acres of TPL’s desert holdings for purpose‑built hyperscale facilities, with an upfront lease payment estimated at $350 million and a long‑term royalty stream tied to the data centers’ revenue. This news was the dominant driver behind the “AI Data Centers in the Texas Desert” headline and the subsequent surge in TPL’s stock price.
TPL is a unique S&P 500 constituent that historically generates cash through royalty and unit‑based revenue from oil and gas production on its ~880,000 acre land base. Its business model has been largely insulated from commodity price swings, delivering steady cash flow and a high‑yield dividend. However, the company has been actively diversifying its asset utilization, seeking non‑energy revenue streams to offset the cyclical nature of the energy sector. The data‑center lease represents the most material non‑energy contract in TPL’s history, effectively adding a recurring, inflation‑linked income source that aligns with the rapid expansion of AI workloads and the attendant demand for low‑latency, power‑rich locations.
The market reaction underscores the strategic significance of this pivot. At a market cap of $20.3 billion, a 7.64% price gain adds roughly $1.55 billion in equity value in a single session, highlighting investor appetite for growth‑oriented, land‑rich assets that can capture the AI infrastructure boom. Moreover, the elevated trading volume indicates heightened participation from both institutional and retail investors, many of whom view the deal as a catalyst that could materially improve TPL’s earnings outlook and dividend sustainability over the medium term.
From a broader perspective, TPL’s rally stands out amid a mixed performance in the financial sector and a general technology sell‑off that weighed on US equity indexes. The stock’s outperformance illustrates how a traditionally energy‑centric royalty company can benefit from sector‑agnostic megatrends such as AI, and it may prompt analysts to reassess TPL’s valuation multiples relative to peers. If the data‑center lease delivers the projected cash flows, TPL could see a meaningful re‑rating, potentially narrowing the discount to its historical royalty‑based peers and positioning the company as a hybrid energy‑real‑estate play within the S&P 500.
Related News
- Sector Update: Financial Stocks Mixed Late Afternoon
- A Deal To Build AI Data Centers In The Texas Desert Sent This Stock Soaring
- Is Texas Pacific Land’s (TPL) Data Center Pivot Quietly Redefining Its Royalty-Driven Business Model?
- Technology Sell-Off Pushes US Equity Indexes Lower
- This Texas Landowner Is the S&P 500’s Top Stock Today. It’s an Unusual AI Play.
Competitor Comparison
Let’s see how TPL stacks up against its main competitors in the oil & gas e&p space.
| Metric | TPL | CYH | USWS |
|---|---|---|---|
| Market Cap | $20.3B | $449.1M | N/A |
| P/E Ratio | 42.7 | 1.3 | N/A |
| Revenue Growth (YoY) | 17.0% | -0.1% | N/A |
| Operating Margin | 73.5% | 8.6% | N/A |
| Profit Margin | 61.7% | 2.6% | N/A |
Analysis
Texas Pacific Land Corporation (TPL) stands out for its sheer scale, with a market capitalization of $20.3 billion—over 45 times larger than Community Health Systems (CYH). This size advantage translates into a robust operating margin of 73.5% and a profit margin of 61.7%, far exceeding CYH’s 8.6% and 2.6% respectively. TPL’s ability to generate earnings from its core land‑lease and royalty business is reflected in these high margins, whereas CYH’s hospital‑operating model yields comparatively modest profitability.
The valuation gap is striking: TPL trades at a price‑to‑earnings (P/E) multiple of 42.7, while CYH’s P/E is just 1.3. A high P/E suggests that investors are pricing in strong future growth or a premium for the stability of TPL’s cash‑flow profile, whereas CYH’s ultra‑low multiple may signal market concerns about its earnings sustainability, competitive pressures in the healthcare sector, or a perception of higher risk. The absence of any financial data for USWS precludes a direct comparison, highlighting the limited visibility of that competitor.
Growth dynamics further differentiate the two firms. TPL posted a 17.0% year‑over‑year revenue increase, indicating that its land‑based assets are appreciating and that lease contracts are expanding. In contrast, CYH recorded essentially flat revenue growth (‑0.1%), reflecting stagnant demand and possibly pricing pressures in its hospital network. Despite TPL’s superior growth, its YTD stock performance has lagged, falling 24.68%, whereas CYH’s shares have risen modestly by 4.4%. This divergence suggests that market sentiment may be penalizing TPL for broader macro‑economic factors or sector rotation, even as its fundamentals remain strong.
Overall, TPL’s strengths lie in its sizable market presence, exceptional profitability, and solid revenue expansion, but its high valuation and recent share‑price decline raise questions about investor expectations and short‑term market sentiment. CYH, while much smaller and less profitable, appears undervalued and has delivered modest positive returns this year. The lack of data on USWS limits any thorough assessment, underscoring the importance of transparent financial reporting for meaningful peer analysis.
Year-to-Date Performance
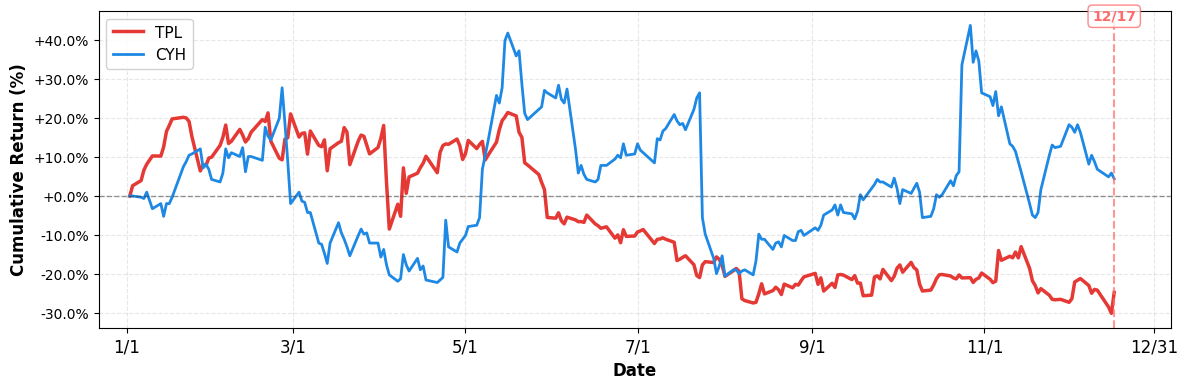
- YTD Performance:
- TPL: -24.68%
- CYH: +4.40%
Risk & Reward
Bullish Case
- Operating margin of 73.5% and profit margin 61.7% indicate strong cash generation.
- Revenue growth of 17% demonstrates accelerating top‑line despite broader energy slowdown.
- AI data‑center partnership leverages vast Texas land, diversifying income beyond royalties.
- Stock’s 7.64% rally reflects investor optimism on emerging tech‑driven revenue streams.
Bearish Case
- P/E ratio of 42.7 is considerably above industry average, suggesting overvaluation.
- Royalty revenue remains tied to volatile oil prices, exposing earnings to commodity swings.
- Capital‑intensive data‑center build may strain balance sheet and dilute existing cash flow.
- Technology sell‑off and mixed financial sector sentiment could pressure TPL’s upward momentum.
What to Watch
Short-term (1-2 weeks):
- Track TPL’s upcoming earnings release for updated royalty and AI data‑center revenue guidance.
- Monitor any SEC filings indicating new land lease contracts for AI infrastructure projects.
- Observe sector‑wide financial‑stock sentiment shifts that could affect TPL’s relative performance.
Medium-term (1-3 months):
- Assess quarterly royalty growth trends as AI data‑center leases mature and expand.
- Evaluate impact of rising P/E ratio on valuation relative to peer oil‑and‑gas firms.
- Track progress of Texas desert AI data‑center construction milestones and timeline adherence.
- Watch regulatory developments affecting land‑use permissions for large‑scale AI infrastructure projects.
Disclaimer: This analysis is for informational and educational purposes only and should not be considered investment advice. The information presented is based on publicly available data and represents the author’s analysis as of December 17, 2025. Stock prices are volatile and past performance does not guarantee future results. Always conduct your own research and consult with a qualified financial advisor before making investment decisions. The author may or may not hold positions in the securities discussed.

Leave a comment