🔥 Today’s Top Gainer Analysis (TPL): View Full Analysis →
📋 Table of Contents
Market Overview
On December 17, 2025 (Wednesday), U.S. equities posted broad declines as investors digested weaker earnings outlooks and lingering inflation concerns. Higher‑than‑expected Treasury yields added pressure on rate‑sensitive sectors, while the dollar strengthened against major currencies. The S&P 500 slipped 1.16%, the Nasdaq fell 1.81%, and the Dow Jones Industrial Average dropped 0.47%, marking a sharp retreat across all major gauges. Volume was light, suggesting that the pullback may be driven more by sentiment than by large institutional repositioning.
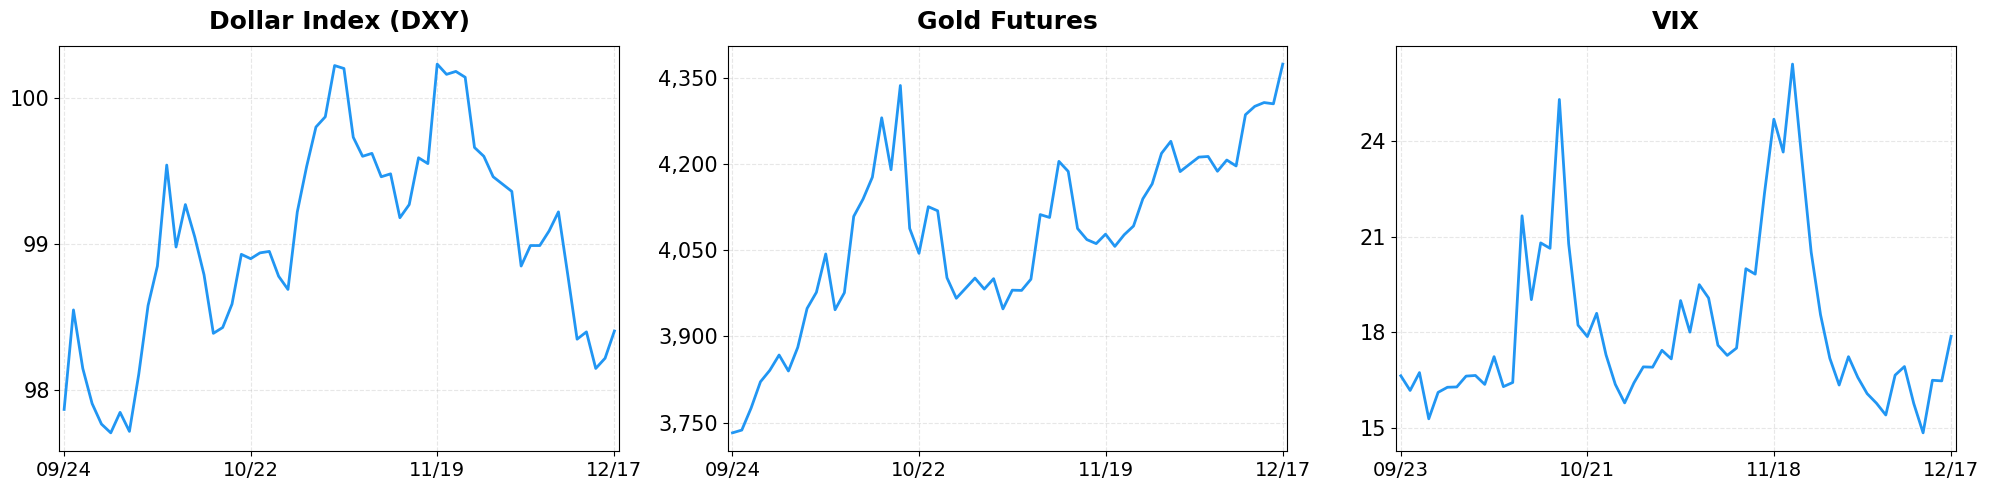
- Dollar Index moved from 98.22 to 98.41 (+0.19%).
- Gold Futures moved from 4304.50 to 4374.00 (+1.61%).
- VIX moved from 16.48 to 17.87 (+8.43%).
Today’s sector performance shows the following movements:

Market News Highlights
On December 17, 2025, equity markets opened lower as concerns over artificial‑intelligence funding resurfaced. Oracle’s shares tumbled after analysts questioned the sustainability of its AI‑related capital commitments, dragging the Dow, S&P 500 and Nasdaq into the red. The broader sentiment was amplified by a separate report highlighting ten high‑profile stocks that are perceived to be inflating an AI bubble, adding pressure to growth‑oriented names and prompting investors to rotate toward more defensive sectors.
Despite the pullback, the market showed resilience in the latter session. The Nasdaq halted a three‑day decline after Tesla surged to a new record high, offsetting some of the AI‑related weakness. Meanwhile, the banking sector posted solid gains; major U.S. banks announced ambitious growth targets and signaled confidence in a “wide open” market environment, which helped lift the financials index and partially compensated for the technology drag.
Macro‑economically, a video briefing described the U.S. economy as entering a “soft patch” heading into 2026, suggesting modest growth and limited inflationary pressure. This outlook supports the notion that monetary policy may stay accommodative, offering a backdrop for risk assets to recover once the AI funding narrative stabilizes. Overall, the market is navigating a delicate balance between AI‑related volatility and underlying strength in banking and high‑growth equities.
Referenced Articles
- Stock market today: Dow, S&P 500, Nasdaq sink as Oracle stock gets hit over AI funding worries
- The stock market is being powered by 10 stocks that are fueling AI bubble fears
- US economy in ‘soft patch’ heading into 2026: The biggest themes
- America’s biggest banks are ending 2025 on top with big growth goals and markets ‘wide open’
- Stock market today: Dow, S&P 500 slip, Nasdaq snaps three-day losing streak as Tesla climbs to record
Index Performance

S&P 500 (-1.16%)
The benchmark closed at 6,721.43, down 78.83 points, as defensive sectors outperformed while cyclical stocks lagged amid tepid consumer spending data. Energy and materials led the gains, offsetting some of the broader weakness, while the index’s valuation metrics slipped further into bearish territory.
NASDAQ Composite (-1.81%)
Tech‑heavy Nasdaq ended at 22,693.32, shedding 418.14 points, driven by a pullback in mega‑cap semiconductor and cloud‑software shares after mixed guidance. The decline also reflected profit‑taking in high‑growth biotech firms after a disappointing earnings season.
Dow Jones Industrial Average (
Top Movers
Top Gainers

- TPL (+7.64%)
- DVN (+5.31%)
- COP (+4.65%)
Top Losers

- GEV (-10.56%)
- VST (-7.69%)
- GNRC (-6.80%)
Magnificent 7
Overview

Performance Comparison: Magnificent 7 vs Major Indices

- YTD Performance:
- S&P 500 (VOO): +15.93%
- NASDAQ-100 (QQQ): +18.12%
- Magnificent 7 (MAGS): +20.59%
M7 Total Market Capitalization

- YTD Market Cap Change:
- $16.05T (1/1) → $18.77T (current), +16.95%
1. AAPL
Price: $271.84 (-1.01%)
- Apple Plans Major iPhone Expansion as Global Sales Accelerate
- Apple Seen Moving From AI Laggard To Leader In 2026
- Services Rides on Apple TV and Arcade: What’s Ahead for Apple Stock?
2. AMZN
Price: $221.27 (-0.58%)
- Amazon Names New AI Group Leader Amid Battle With Microsoft, Google
- Amazon Names New AI Chief Amid Battle to Take on Tech Rivals
- Amazon shakes up AI team as veteran Prasad leaves, DeSantis promoted
3. GOOGL
Price: $296.72 (-3.21%)
- This Tech Play Smokes Google, Nvidia, And All Mag 7 Stocks Year To Date
- Why Alphabet (GOOGL) Shares Are Falling Today
- Update: Google Reportedly Files Lawsuit Against Chinese ‘Darcula’ Group Over Alleged Phishing Scheme
4. META
Price: $649.41 (-1.18%)
- Meta Rolls Out Cross-App Age Verification System to Address Child Safety Rules
- Google teams with Meta’s PyTorch to chip away at Nvidia’s moat, Reuters says
- Should You Buy Meta Platforms Stock Before 2026?
5. MSFT
Price: $476.12 (-0.06%)
- Amazon Names New AI Group Leader Amid Battle With Microsoft, Google
- How to trade cash-secured puts: Options playbook
- The stock market is being powered by 10 stocks that are fueling AI bubble fears
6. NVDA
Price: $170.94 (-3.81%)
- This Tech Play Smokes Google, Nvidia, And All Mag 7 Stocks Year To Date
- Better AI Stock: ASML vs. Nvidia
- Stock market today: Dow, S&P 500, Nasdaq sink as Oracle stock gets hit over AI funding worries
7. TSLA
Price: $467.26 (-4.62%)
- Tesla closes at record high, crude oil falls: Market takeaways
- Stock market today: Dow, S&P 500 slip, Nasdaq snaps three-day losing streak as Tesla climbs to record
- Tesla Faces Possible California Sales Suspension. Why Investors Aren’t Concerned.
Disclaimer: This market briefing is for informational and educational purposes only and should not be considered investment advice. The information presented is based on publicly available data and represents the author’s analysis as of December 17, 2025. Stock prices are volatile and past performance does not guarantee future results. Always conduct your own research and consult with a qualified financial advisor before making investment decisions. The author may or may not hold positions in the securities discussed.
- S&P 500 (VOO): +15.93%
- NASDAQ-100 (QQQ): +18.12%
- Magnificent 7 (MAGS): +20.59%
- $16.05T (1/1) → $18.77T (current), +16.95%

Leave a comment