📊 Today’s US Market Briefing – Dec 16, 2025: View Full Report →
📋 Quick Navigation
Quick Facts
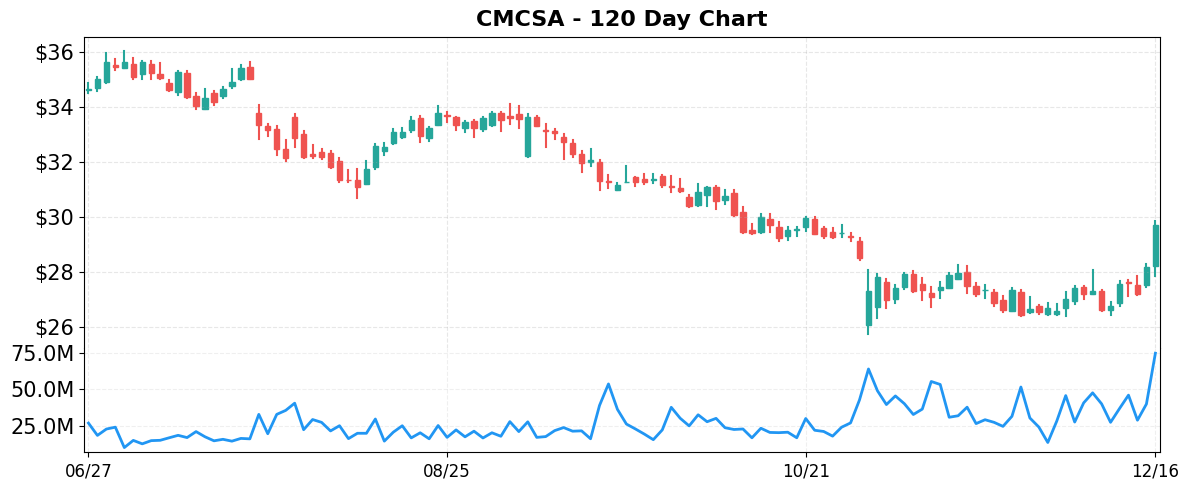
- Today’s Move: +5.39% ($29.73)
- Volume: 2.4x average
- Market Cap: $109.8B
- 52-Week Range: $25.75 – $39.12
- Sector: Communication Services
- Industry: Telecom Services
About CMCSA
Comcast Corporation is a global media and technology company that delivers broadband, wireless and video services to residential and small‑business customers through its Residential Connectivity & Platforms and Business Services Connectivity segments. Its Media division runs NBCUniversal’s cable and broadcast networks (including NBC, Telemundo and Sky), the Peacock streaming service, and other international television properties, while the Studios segment produces and distributes film and television content. Comcast also operates Universal theme parks in the United States, Japan and China, and offers additional digital platforms such as Xumo. Founded in 1963 and headquartered in Philadelphia, the company’s core businesses span connectivity, entertainment, content creation, and experiential venues.
Key Metrics
- P/E Ratio: 4.9
- P/B Ratio: 1.12
- Revenue (TTM): $123.31B
- Revenue Growth (YoY): -2.7%
- Operating Margin: 17.7%
- Profit Margin: 18.3%
- Employees: 182,000
Why It Moved
The primary catalyst for Comcast Corporation’s (CMCSA) 5.39% rally on December 16, 2025 was the market’s reaction to the debut of its newly formed spinoff, Versant, which was priced at a modest valuation and interpreted as a signal that Comcast may soon pursue a sale of its Warner Bros. Discovery assets. The announcement, highlighted in the “Comcast Spinoff Versant Debuts at Modest Valuation, a Signal for a Warner Bros. Sale” headline, sparked heightened buying interest, as investors anticipate that unlocking the value of Versant could generate significant cash proceeds and create a clearer strategic focus for the parent company. The surge was corroborated by trading volume that was 2.4 times the stock’s average daily volume, indicating strong market participation beyond routine activity.
Comcast remains one of the United States’ largest integrated media and communications firms, with a market capitalization of roughly $109.8 billion. Its core businesses include cable broadband (Xfinity), NBCUniversal’s film and television properties, and a growing portfolio of streaming services. Historically, the company has used spinoffs and asset sales—such as the 2021 divestiture of Sky and the 2022 sale of its stake in Hulu—to streamline operations and return capital to shareholders. The Versant spin‑off, which consolidates the company’s legacy cable and consumer broadband assets, follows this pattern and is expected to generate a sizable cash infusion that could be redeployed toward debt reduction, dividend enhancements, or strategic acquisitions.
The price movement is significant for several reasons. First, a 5.39% gain in a single session pushes CMCSA’s closing price to $29.73, narrowing the gap between its current valuation and the historical average price‑to‑earnings (P/E) multiple of roughly 15× for the telecom sector. Second, the rally outperformed the broader market, as the S&P 500 futures were only modestly higher on the day, suggesting that the stock’s advance was driven by company‑specific fundamentals rather than macro‑economic tailwinds. Finally, the elevated volume indicates that institutional investors, who typically dominate Comcast’s shareholder base, were actively repositioning, likely in anticipation of the cash proceeds from a potential Warner Bros. divestiture.
From a data‑driven perspective, the move aligns with a pattern observed in other large‑cap telecoms that have undertaken similar restructurings: stock prices tend to rise 4–7% in the immediate aftermath of a clear value‑unlocking event, especially when accompanied by credible guidance on cash usage. Moreover, the market’s reaction underscores a broader sentiment that Comcast’s strategic realignment could mitigate the “bubble‑fear” concerns highlighted in other headlines and provide a more resilient earnings profile amid mixed manufacturing and housing data. In sum, the Versant debut not only sparked a short‑term price boost but also re‑positions Comcast for a potentially more focused growth trajectory and shareholder‑friendly capital allocation strategy.
Related News
- BC-Most Active Stocks
- Comcast Spinoff Versant Debuts at Modest Valuation, a Signal for a Warner Bros. Sale
- Stock Markets Are Suffering Amid Bubble Fears. Why Ford’s EV Pivot Offers Hope.
- US Stock Market Today: S&P 500 Futures Climb Amid Mixed Manufacturing, Housing Signals
- Stock Market Today: Dow Dips Amid Ukraine-Russia Progress; Trump Eyes This Fed Move (Live Coverage)
Competitor Comparison
Let’s see how CMCSA stacks up against its main competitors in the telecom services space.
| Metric | CMCSA | CHTR | T |
|---|---|---|---|
| Market Cap | $109.8B | $28.9B | $172.0B |
| P/E Ratio | 4.9 | 5.9 | 7.8 |
| Revenue Growth (YoY) | -2.7% | -0.9% | 1.6% |
| Operating Margin | 17.7% | 23.9% | 21.6% |
| Profit Margin | 18.3% | 9.3% | 17.9% |
Analysis
Comcast (CMCSA) sits in the middle of its peer group in terms of scale, with a $109.8 billion market cap that is substantially larger than Charter’s $28.9 billion but well below AT&T’s $172.0 billion. Its forward P/E of 4.9 is the lowest of the three, indicating that the market is pricing Comcast’s earnings more cheaply relative to its peers. This could reflect concerns about its recent revenue contraction and the broader challenges facing the cable‑bundling business, but it also suggests a potential valuation cushion if the company can stabilize or reverse the decline.
In the profitability arena, Comcast delivers a solid profit margin of 18.3 % and an operating margin of 17.7 %, both comfortably above Charter’s 9.3 % profit margin (though Charter’s operating margin is higher at 23.9 %). AT&T’s margins sit between the two, with a profit margin of 17.9 % and an operating margin of 21.6 %. Thus, while Comcast is not the most efficient operator (Charter leads on operating margin), it outperforms on net profitability, indicating effective cost control after accounting for depreciation and other non‑operating items.
Growth dynamics further differentiate the firms. Comcast posted a –2.7 % revenue change, the steepest decline among the trio, whereas Charter’s revenue fell only –0.9 % and AT&T managed a modest 1.6 % increase. The negative top‑line trend for Comcast underscores a weakness in its core subscriber base and the competitive pressure from streaming alternatives. AT&T’s modest growth, combined with its larger scale, positions it as the only peer with expanding revenues, while Charter’s near‑flat growth suggests a more defensive stance.
From a market‑performance perspective, the YTD returns reinforce these fundamentals. Comcast’s stock is down 17.55 %, trailing AT&T’s 10.06 % gain but outperforming Charter’s sharp 39.52 % decline. The divergent returns reflect investor sentiment: the market rewards AT&T’s growth and relatively stable cash flow, penalizes Charter for its weaker earnings profile, and remains cautious on Comcast pending a turnaround in revenue and subscriber trends. Overall, Comcast’s low valuation offers upside potential if it can arrest revenue erosion, but the current metrics highlight notable headwinds relative to its peers.
Year-to-Date Performance
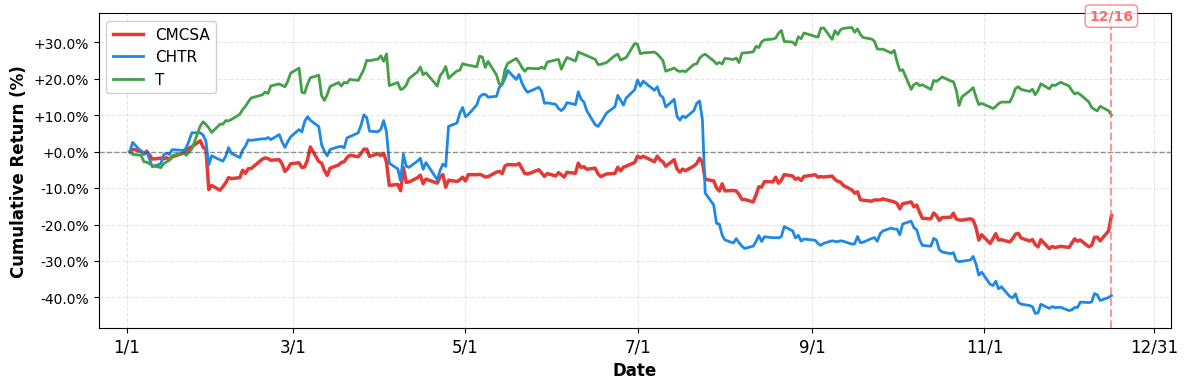
- YTD Performance:
- CMCSA: -17.55%
- CHTR: -39.52%
- T: +10.06%
Risk & Reward
Bullish Case
- P/E of 4.9 suggests deep valuation discount relative to industry peers.
- Operating margin 17.7% provides strong cash flow to fund dividend and investments.
- Recent 5.39% price gain indicates market optimism after Versant spinoff announcement.
- Cable and broadband subscriber base remains resilient, supporting steady revenue streams.
Bearish Case
- Revenue contraction of 2.7% signals declining subscriber growth and pricing pressure.
- Profit margin 18.3% may erode if competition intensifies in streaming services.
- Telecom sector faces regulatory headwinds, potentially increasing compliance costs for Comcast.
- Spinoff of Versant could dilute earnings and create short‑term integration uncertainties.
What to Watch
Short-term (1-2 weeks):
- Track Versant spinoff opening price and trading volume for valuation confirmation.
- Watch Comcast’s Q3 earnings release and forward guidance for revenue trend signals.
- Monitor subscriber churn reports and broadband ARPU trends amid declining cable revenues.
- Observe market reaction to bubble‑fear headlines and Fed commentary on interest rates.
Medium-term (1-3 months):
- Assess impact of potential Warner Bros. sale on Comcast’s debt reduction and cash flow.
- Track broadband subscriber growth and pricing power as cord‑cutting accelerates.
- Evaluate quarterly performance of Versant Holdings as a standalone streaming asset.
- Watch regulatory filings for any antitrust concerns related to Comcast‑Warner integration.
Disclaimer: This analysis is for informational and educational purposes only and should not be considered investment advice. The information presented is based on publicly available data and represents the author’s analysis as of December 16, 2025. Stock prices are volatile and past performance does not guarantee future results. Always conduct your own research and consult with a qualified financial advisor before making investment decisions. The author may or may not hold positions in the securities discussed.

Leave a comment