🔥 Today’s Top Gainer Analysis (CMCSA): View Full Analysis →
📋 Table of Contents
Market Overview
On December 16, 2025, U.S. equities posted a mixed session as risk‑off sentiment weighed on broad‑based indices while technology‑heavy stocks found modest buying interest. The S&P 500 slipped 0.24% to 6,800.26, reflecting pressure from slower earnings updates in consumer discretionary and industrial sectors. Meanwhile, the Nasdaq Composite managed a 0.23% gain, ending at 23,111.46, as investors rotated into growth‑oriented names despite the broader market pullback.
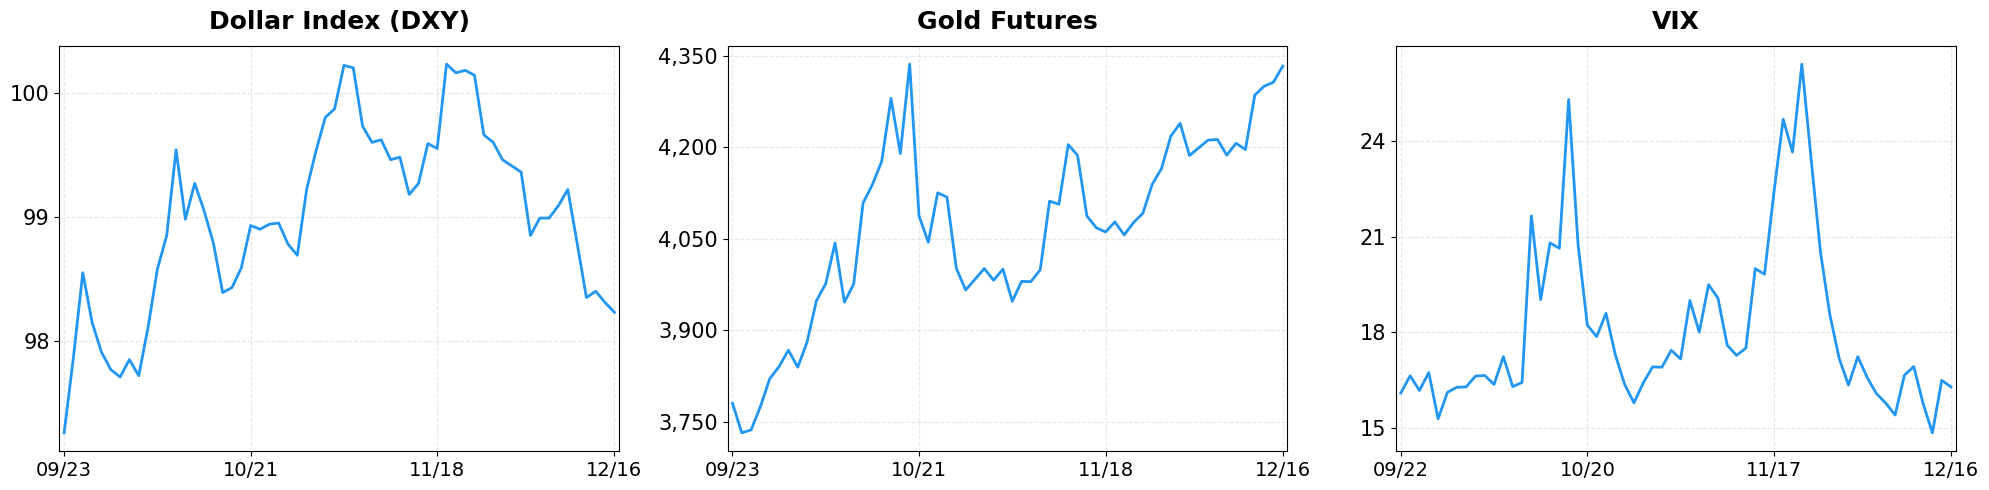
- Dollar Index moved from 98.31 to 98.23 (-0.08%).
- Gold Futures moved from 4306.70 to 4333.10 (+0.61%).
- VIX moved from 16.50 to 16.29 (-1.27%).
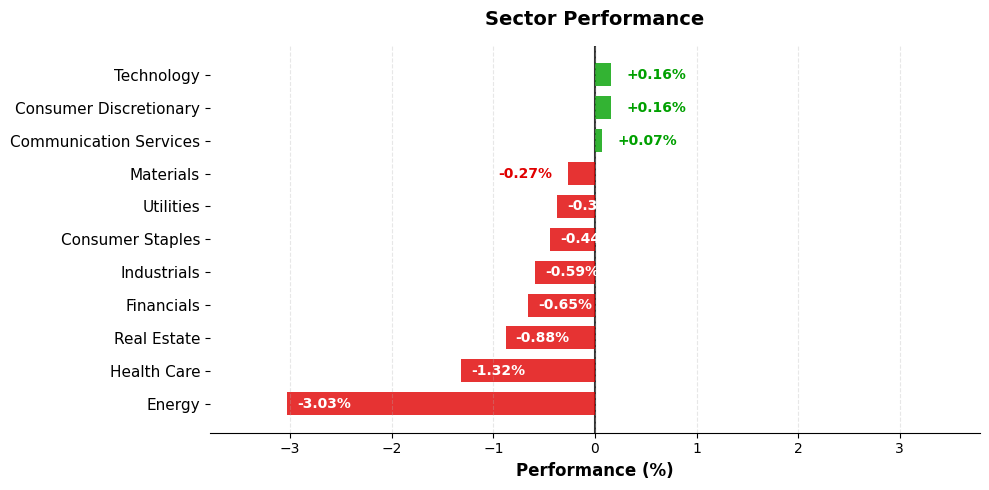
Today’s sector performance shows the following movements:
Market News Highlights
Equity markets showed mixed signals on December 16, 2025. The Dow Jones Industrial Average and the S&P 500 slipped modestly, reflecting lingering caution ahead of the upcoming jobs report, while the Nasdaq managed to break a three‑day losing streak, buoyed by Tesla’s surge to an all‑time high. The tech rally was limited, however, as broader technology stocks retreated, indicating a rotation toward more defensive sectors as investors await clearer labor‑market data. This divergence underscores a market still grappling with the balance between growth optimism and macro‑economic uncertainty.
Commodities added another layer of complexity, with crude oil prices sliding to a four‑year low. The decline was driven by concerns over excess supply and weaker global demand, pressuring energy‑related equities. Meanwhile, cloud‑computing firm CoreWeave experienced a sharp sell‑off amid speculation that the AI investment boom may be overheating, prompting a reassessment of valuations in the AI‑centric niche. The combination of lower oil prices and AI‑bubble worries contributed to a broader rotation into small‑cap and value‑oriented stocks, as highlighted in the “Tech rotation, small caps, oil vs. energy stocks” commentary.
Overall, the market’s mixed performance reflects a cautious stance: investors are digesting labor‑market indicators while navigating sector‑specific catalysts such as Tesla’s record run and the retreat in oil and AI‑related equities. The net effect is a tentative outlook, with volatility likely to persist until the jobs data provides more definitive direction.
Referenced Articles
- Stock market today: Dow, S&P 500 slip, Nasdaq snaps three-day losing streak as Tesla climbs to record
- Oil falls to 4-year low, CoreWeave slides on AI bubble concerns
- Tech rotation, small caps, oil vs. energy stocks: Market Takeaways
- Stock market today: Dow, S&P 500, Nasdaq slip as tech slides ahead of jobs report
- US Equity Indexes Mixed in Final Leg of Trading as Investors Parse Labor Market Data
Index Performance
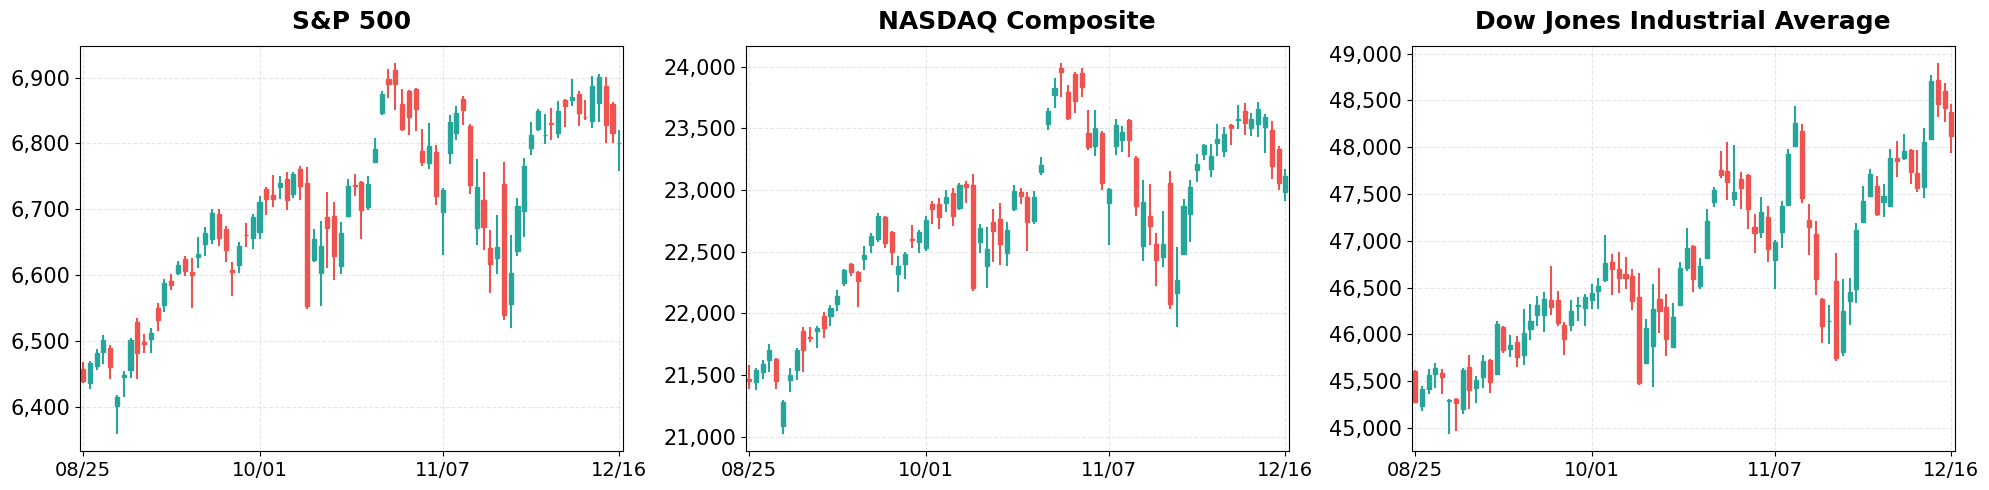
S&P 500 (-0.24%)
The benchmark fell 16.25 points to 6,800.26, driven by a rally in Treasury yields that heightened discount rates for future cash flows. Defensive stocks such as utilities and health care outperformed, partially offsetting the decline in cyclical components.
NASDAQ Composite (+0.23%)
The tech‑heavy index rose 54.05 points to 23,111.46, buoyed by strong earnings beats from several semiconductor firms and a rebound in cloud‑service providers. Momentum in the sector helped lift the Nasdaq even as broader sentiment remained cautious.
Dow Jones Industrial Average (-0.62%)
The Dow slipped 302.30 points to close at 48,114.26, with notable weakness in industrials and energy stocks that lagged behind the market’s overall direction. The decline underscored lingering concerns over global supply‑chain constraints and higher input costs.
Top Movers
Top Gainers
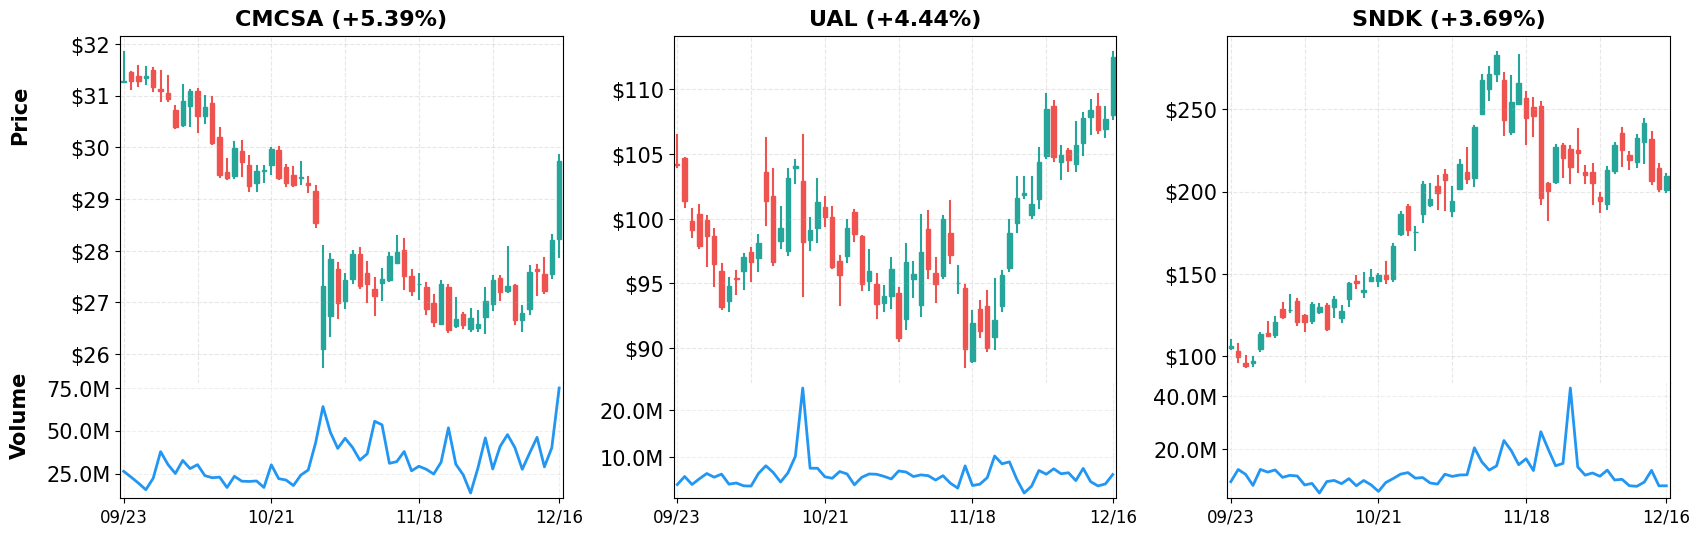
- CMCSA (+5.39%)
- UAL (+4.44%)
- SNDK (+3.69%)
Top Losers
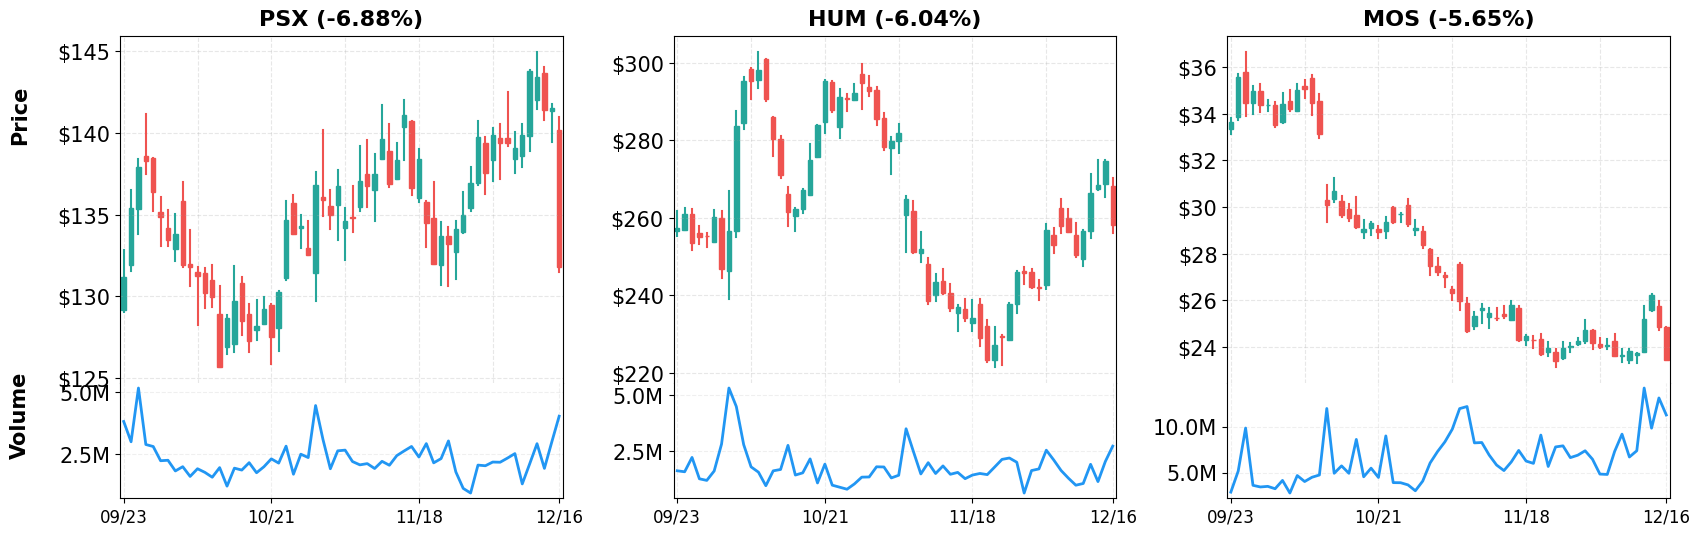
- PSX (-6.88%)
- HUM (-6.04%)
- MOS (-5.65%)
Magnificent 7
Overview
Performance Comparison: Magnificent 7 vs Major Indices
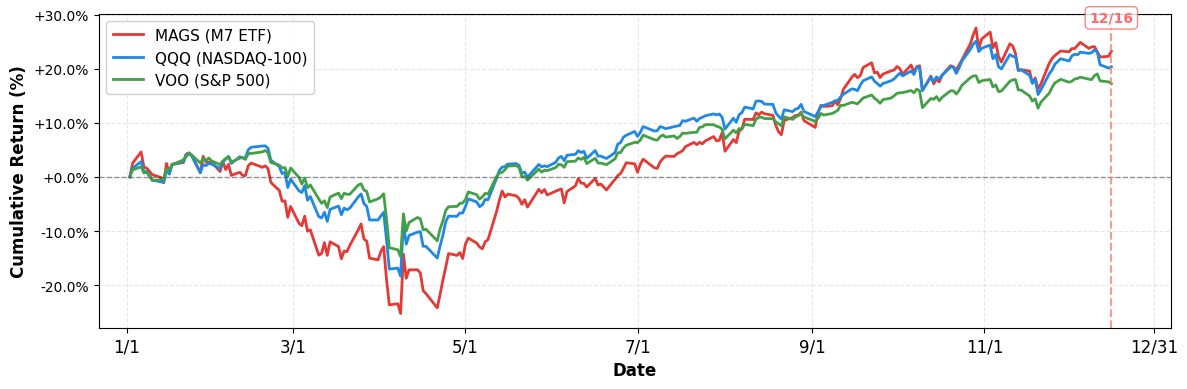
- YTD Performance:
- S&P 500 (VOO): +17.23%
- NASDAQ-100 (QQQ): +20.35%
- Magnificent 7 (MAGS): +23.23%
M7 Total Market Capitalization
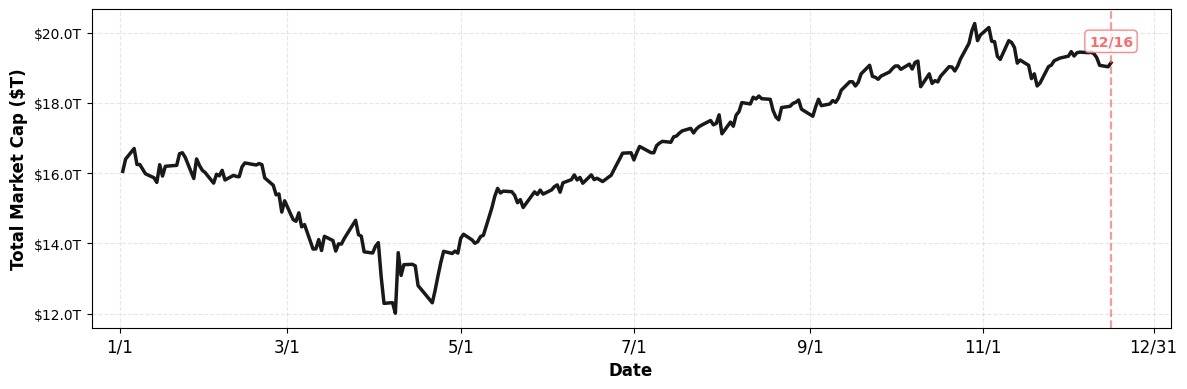
- YTD Market Cap Change:
- $16.05T (1/1) → $19.14T (current), +19.25%
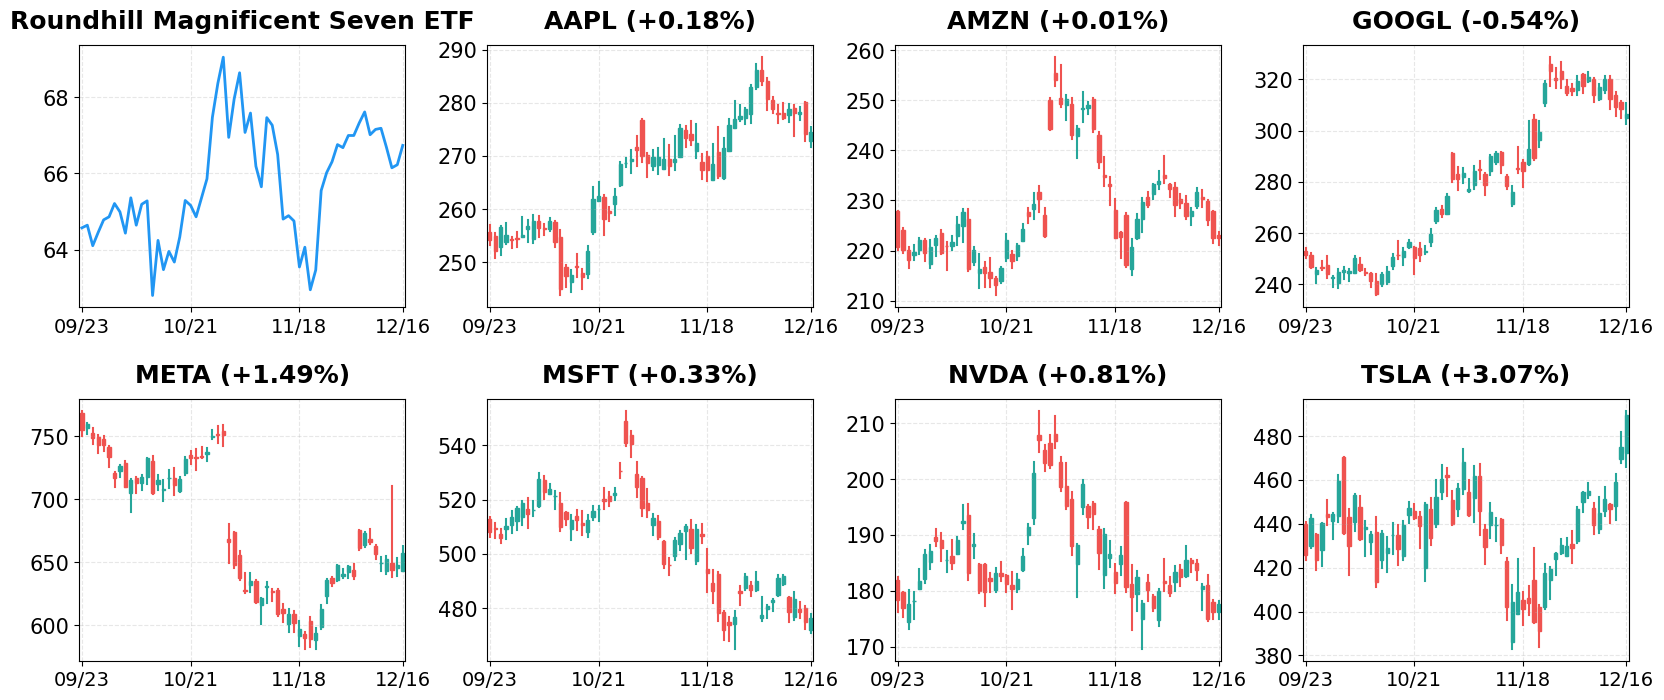
1. AAPL
Price: $274.61 (+0.18%)
- Top Midday Stories: Pfizer Falls Following 2026 Outlook; Netflix-iHeartMedia Exclusive Deal; Apple’s Possible iPhone Lineup Expansion
- Developers Press EU to Act on Apple Fees After U.S. Court Ruling
- U.S. government to recruit workforce from popular crypto exchanges
2. AMZN
Price: $222.56 (+0.01%)
- Meta Puts Instagram Reels On Amazon’s Fire TV. How Video Fits Into Zuckerberg’s AI Push.
- Amazon Freight Partners: Building trucking companies without buying tractors
- iRobot co-founder says FTC’s opposition to Amazon deal was ‘wrong-minded’ following bankruptcy filing
3. GOOGL
Price: $306.57 (-0.54%)
- Tesla Board Gets $3 Billion in Stock Awards, Outpaces Alphabet, Meta, Nvidia
- Where the AI trade will see ‘massive bifurcation’ in 2026
- US Threatens to Retaliate Against EU Firms Over Digital Tax
4. META
Price: $657.15 (+1.49%)
- Why Meta is My Largest Position By Far
- Meta Puts Instagram Reels On Amazon’s Fire TV. How Video Fits Into Zuckerberg’s AI Push.
- Tesla Board Gets $3 Billion in Stock Awards, Outpaces Alphabet, Meta, Nvidia
5. MSFT
Price: $476.39 (+0.33%)
- Microsoft’s AI advantage isn’t all about OpenAI — and Wall Street loves it
- Tesla Board Gets $3 Billion in Stock Awards, Outpaces Alphabet, Meta, Nvidia
- Oracle’s $248 Billion AI Bet Just Shook Wall Street–And It’s Not on the Balance Sheet
6. NVDA
Price: $177.72 (+0.81%)
- Stock Market Today: Dow Slides, Nasdaq Positive After Jobs Data; Nvidia Rises (Live Coverage)
- Nvidia Rival Biren Plans Hong Kong IPO After Winning Regulatory Approval
- Tesla Board Gets $3 Billion in Stock Awards, Outpaces Alphabet, Meta, Nvidia
7. TSLA
Price: $489.88 (+3.07%)
- Stock market today: Dow, S&P 500 slip, Nasdaq snaps three-day losing streak as Tesla climbs to record
- Tesla bear case: This analyst is ‘skeptical’ on robotaxi growth
- Tesla Stock Hits New Record High The Day After Longtime Bull Decided To Take Profit
Disclaimer: This market briefing is for informational and educational purposes only and should not be considered investment advice. The information presented is based on publicly available data and represents the author’s analysis as of December 16, 2025. Stock prices are volatile and past performance does not guarantee future results. Always conduct your own research and consult with a qualified financial advisor before making investment decisions. The author may or may not hold positions in the securities discussed.

Leave a comment