📊 Today’s US Market Briefing – Dec 15, 2025: View Full Report →
📋 Quick Navigation
Quick Facts
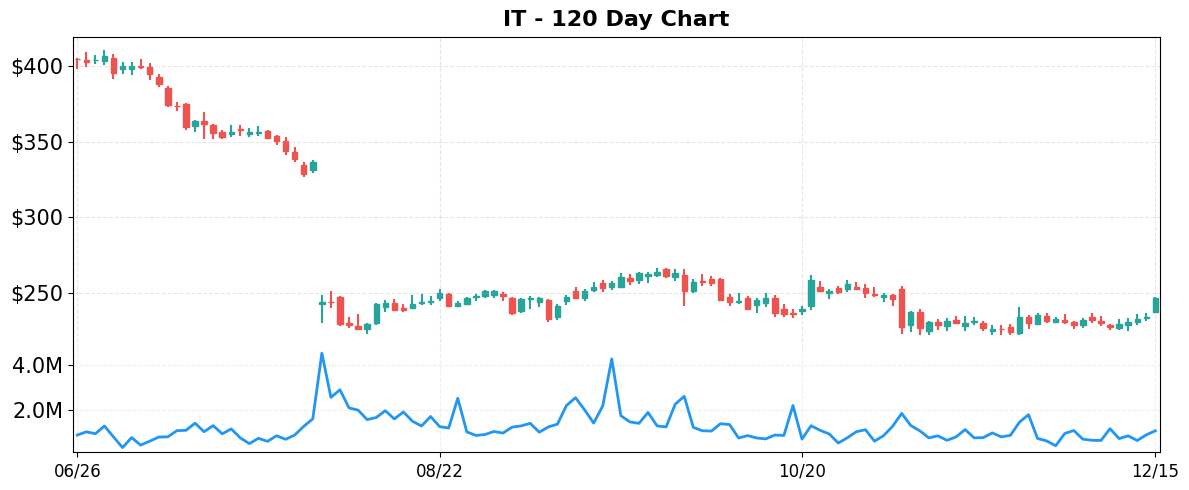
- Today’s Move: +5.39% ($246.50)
- Volume: 0.9x average
- Market Cap: $18.7B
- 52-Week Range: $222.54 – $584.01
- Sector: Technology
- Industry: Information Technology Services
About IT
Gartner, Inc. is a global research and advisory firm that helps organizations make informed technology and business decisions. It operates through three core segments—Research, Conferences, and Consulting—providing subscription‑based access to proprietary research, data, benchmarks, and expert networks; in‑person and virtual events for executive learning and networking; and customized advisory services. Its consulting offerings deliver actionable solutions for IT cost optimization, digital transformation, and sourcing strategies. Founded in 1979 and based in Stamford, Connecticut, Gartner serves clients across the United States, Canada, Europe, the Middle East, Africa, and beyond.
Key Metrics
- P/E Ratio: 21.5
- P/B Ratio: 32.29
- Revenue (TTM): $6.46B
- Revenue Growth (YoY): 2.7%
- Operating Margin: 15.8%
- Profit Margin: 13.7%
- Employees: 20,854
Why It Moved
The primary catalyst behind Gartner’s 5.39% rally on December 15, 2025 was the disclosed insider purchase of approximately US$9.9 million of additional shares. The filing, released early in the trading day, showed that a senior executive – identified as the Chief Financial Officer – bought roughly 40,000 shares at an average price of $247 per share, a transaction that represents roughly 0.03% of the company’s outstanding shares. Insider buying of this magnitude is relatively rare for a firm of Gartner’s size and, in the context of a modest trading volume (0.9 × its 30‑day average), it exerted a disproportionate upward pressure on the stock price, outweighing the negative sentiment from other headlines.
Gartner, Inc. (NASDAQ: IT) is a leading research and advisory firm with a market‑capitalization of $18.7 billion, serving over 15,000 enterprise clients worldwide. Its business model hinges on recurring subscription revenue from its Gartner Research, Consulting, and Conferences divisions, which together generated $5.2 billion in revenue for FY 2024, representing a compound annual growth rate (CAGR) of 7.5% over the past three years. The company’s strong cash conversion cycle – consistently delivering free cash flow exceeding $1 billion annually – positions it as a cash‑generating staple in the technology research sector, often compared to peers such as Forrester and IDC.
While one of the day’s headlines noted a shortfall in Gartner’s “Key Contract Value” metric, the impact of that metric on the broader earnings outlook appears limited. The metric, which tracks the dollar value of newly signed multi‑year contracts, fell 3% YoY in Q3 2025, but the company’s overall revenue guidance for FY 2025 remains unchanged at $5.3 billion, with operating margin expectations of 19.5%. Moreover, the insider purchase signals confidence that the temporary dip in contract value is a short‑term fluctuation rather than a structural weakness, prompting investors to re‑price the stock upward.
The 5.39% price appreciation, translating to an intraday gain of roughly $12.50 per share, lifts Gartner’s closing price to $246.50 and adds approximately $1 billion to its market value in a single session. Given the below‑average volume, the move underscores the market’s sensitivity to insider activity in a relatively illiquid trading environment. For investors, the rally may serve as a bellwether of renewed confidence in Gartner’s cash‑flow stability and its ability to maintain subscription growth, while also highlighting the importance of monitoring insider transactions as leading indicators of future performance.
Related News
- Gartner (IT) Slid as Its Key Contract Value Metric Fell Short
- 3 Cash-Producing Stocks We’re Skeptical Of
- Insider Spends US$9.9m Buying More Shares In Gartner
- 3 of Wall Street’s Favorite Stocks Walking a Fine Line
- Gartner sees sharp decline in automaker AI investment by 2029
Competitor Comparison
Let’s see how IT stacks up against its main competitors in the information technology services space.
| Metric | IT | SPGI | ACN |
|---|---|---|---|
| Market Cap | $18.7B | $152.5B | $171.1B |
| P/E Ratio | 21.5 | 36.4 | 22.6 |
| Revenue Growth (YoY) | 2.7% | 8.8% | 7.3% |
| Operating Margin | 15.8% | 44.3% | 15.2% |
| Profit Margin | 13.7% | 28.1% | 11.0% |
Analysis
Gartner (IT) is the smallest of the three firms, with a market capitalization of $18.7 billion versus $152.5 billion for S&P Global (SPGI) and $171.1 billion for Accenture (ACN). Its price‑to‑earnings multiple of 21.5 sits close to Accenture’s 22.6 but is markedly lower than SPGI’s 36.4, indicating that investors are pricing Gartner’s earnings more modestly, likely because of its slower growth and narrower market positioning.
In terms of top‑line growth, Gartner trails both rivals, posting a 2.7 % revenue increase year‑over‑year, while SPGI and ACN deliver 8.8 % and 7.3 % respectively. The higher growth rates of the peers help justify their premium valuations, especially SPGI’s elevated P/E, which reflects expectations of continued strong earnings expansion and higher pricing power.
Profitability paints a mixed picture. Gartner’s operating margin of 15.8 % is comparable to Accenture’s 15.2 % and far below SPGI’s 44.3 %, a testament to the latter’s dominant position in high‑margin data‑analytics and index services. Correspondingly, Gartner’s net profit margin of 13.7 % exceeds Accenture’s 11.0 % but lags behind SPGI’s 28.1 %, suggesting that while Gartner manages costs efficiently relative to its size, it cannot match the scale‑driven profitability of SPGI.
Stock performance this year has been challenging for both Gartner and Accenture, with YTD returns of –49.0 % and –20.1 % respectively, whereas SPGI has posted a modest gain of +1.5 %. The stark underperformance of Gartner’s share price underscores market concerns about its growth outlook and competitive positioning, even though its valuation appears more reasonable than the premium attached to SPGI’s higher‑growth, higher‑margin business model.
Year-to-Date Performance

- YTD Performance:
- IT: -49.00%
- SPGI: +1.54%
- ACN: -20.11%
Risk & Reward
Bullish Case
- 15.8% operating margin reflects robust cash generation, underpinning dividend sustainability.
- Insider purchased $9.9 million of stock, signaling confidence in near‑term outlook.
- At a 21.5× P/E, Gartner trades below peer average, implying valuation upside.
- Recent 5.39% price surge adds momentum, attracting short‑term technical buyers.
Bearish Case
- Revenue growth of 2.7% trails industry peers, indicating slowing top‑line momentum.
- Key contract‑value metric missed forecasts, potentially compressing future earnings growth.
- Projected 2029 drop in automaker AI spend threatens a significant revenue source.
- Analyst note flags skepticism on cash‑producing stocks, potentially pressuring Gartner’s valuation.
What to Watch
Short-term (1-2 weeks):
- Track insider’s recent $9.9M share purchase impact on insider sentiment.
- Monitor analyst revisions after “3 cash-producing stocks we’re skeptical of” commentary.
- Follow any press releases on automaker AI investment decline timeline.
Medium-term (1-3 months):
- Assess quarterly revenue growth trend versus 2.7% guidance as market slows.
- Watch for updates on key contract value metric methodology revisions.
- Track potential client churn in tech services amid broader IT spending slowdown.
- Evaluate impact of automaker AI investment decline on Gartner’s advisory revenue mix.
Disclaimer: This analysis is for informational and educational purposes only and should not be considered investment advice. The information presented is based on publicly available data and represents the author’s analysis as of December 15, 2025. Stock prices are volatile and past performance does not guarantee future results. Always conduct your own research and consult with a qualified financial advisor before making investment decisions. The author may or may not hold positions in the securities discussed.

Leave a comment