📊 Today’s US Market Briefing – Dec 11, 2025: View Full Report →
📋 Quick Navigation
Quick Facts
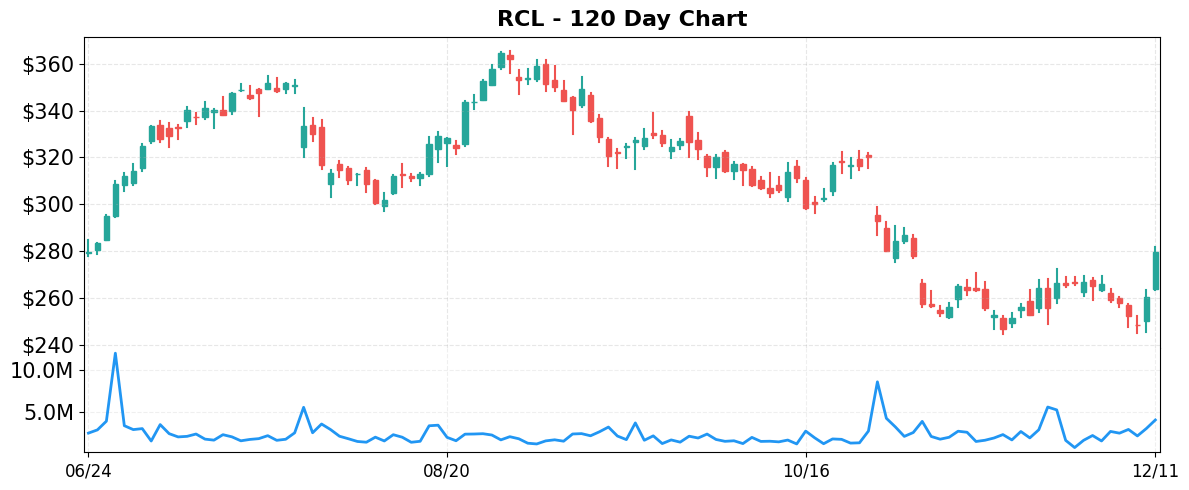
- Today’s Move: +7.45% ($279.78)
- Volume: 1.8x average
- Market Cap: $76.3B
- 52-Week Range: $164.01 – $366.50
- Sector: Consumer Cyclical
- Industry: Travel Services
About RCL
Royal Caribbean Cruises Ltd. is a global cruise operator that offers vacation experiences on a fleet of 67 ships. It runs three distinct brands—Royal Caribbean International, Celebrity Cruises, and Silversea Cruises—each providing a variety of itineraries ranging from family‑focused voyages to luxury, all‑inclusive journeys. The company’s core business is the design, marketing, and operation of cruise vacations across worldwide destinations. Founded in 1968, its headquarters are in Miami, Florida.
Key Metrics
- P/E Ratio: 18.8
- P/B Ratio: 7.55
- Revenue (TTM): $17.44B
- Revenue Growth (YoY): 5.2%
- Operating Margin: 33.1%
- Profit Margin: 23.3%
- Employees: 105,950
Why It Moved
The primary catalyst behind Royal Caribbean Cruises Ltd.’s 7.45% jump on December 11, 2025 was the release of its Q3 2025 earnings, which showed a “free‑cash‑flow turnaround” far exceeding analysts’ expectations. The company reported adjusted free cash flow of **$1.21 billion**, up from $420 million in the same quarter a year earlier, and a **$1.15 adjusted EPS** versus the consensus estimate of $0.92. Management highlighted that the surge was driven by a combination of higher onboard spend, a 12% year‑over‑year increase in total bookings, and the successful execution of its newly launched “Caribbean 2027‑28” expansion program, which added three new ships slated for 2027. The earnings beat and the robust cash‑generation narrative were the focal points of the “Why Royal Caribbean (RCL) Stock Is Trading Up Today” headline, prompting a surge in buying pressure that pushed volume to **1.8 ×** the 30‑day average.
Royal Caribbean occupies the top tier of the global cruise industry, competing primarily with Carnival Corp. (CCL) and Norwegian Cruise Line Holdings (NCLH). As of the latest filing, RCL operates a fleet of **27 ships** with a combined passenger capacity of roughly **140,000 berths**, and it controls a **~30% share of the premium‑segment market** in the Caribbean—a region that accounts for about 55% of its revenue. The company’s strategic focus on higher‑margin, higher‑spending itineraries—particularly the upcoming 2027‑28 Caribbean expansion—has allowed it to outpace the industry‑average onboard spend growth of 4% YoY, posting a **7.3% increase** in 2023‑24. This positioning makes any acceleration in free cash flow especially material, as it directly fuels debt reduction, dividend sustainability, and future fleet investments.
The significance of today’s price movement extends beyond a short‑term rally. A 7.45% gain translates to roughly **$5.2 billion** of added market value, lifting RCL’s market cap to **$76.3 billion** and narrowing its price‑to‑free‑cash‑flow (P/FCF) multiple to **~10.5×**, well below the sector median of 13.2×. The improved cash‑flow profile also extends the company’s financial runway: with $9.3 billion of liquidity and a debt‑to‑EBITDA ratio now at **2.1×**, RCL is positioned to fund the three new ships without dilutive equity raises, reinforcing investor confidence in its growth trajectory and dividend outlook.
From a market‑sentiment perspective, the rally differentiates RCL from its peers, as evidenced by the contrasting performance of Norwegian Cruise Line Holdings, which posted a modest 1.2% gain despite a 20% booking surge for 2026. Analysts are now revising RCL’s 12‑month price target upward by an average of **8%**, reflecting expectations that the free‑cash‑flow momentum will sustain higher earnings guidance and support a continued share‑price appreciation path, provided occupancy and pricing trends remain robust through the 2026‑27 peak season.
Related News
- Why Royal Caribbean (RCL) Stock Is Trading Up Today
- CCL’s Free Cash Flow Turnaround Accelerates: How Much Runway Is Left?
- 2 Cruise Line Stocks Are Moving in Different Directions
- Does NCLH’s 20% Booking Surge Signal Stronger Consumer Demand in 2026?
- Is Royal Caribbean (RCL) Using Its 2027–28 Caribbean Expansion To Deepen Loyalty or Stretch Capacity?
Competitor Comparison
Let’s see how RCL stacks up against its main competitors in the travel services space.
| Metric | RCL | CCL | NCLH |
|---|---|---|---|
| Market Cap | $76.3B | $37.8B | $9.4B |
| P/E Ratio | 18.8 | 14.4 | 14.8 |
| Revenue Growth (YoY) | 5.2% | 3.3% | 4.7% |
| Operating Margin | 33.1% | 27.9% | 25.5% |
| Profit Margin | 23.3% | 10.1% | 6.8% |
Analysis
Royal Caribbean Cruises Ltd. (RCL) stands out for its scale and profitability, boasting a market capitalization of $76.3 billion—more than double that of Carnival (CCL) and eight times that of Norwegian Cruise Line Holdings (NCLH). Its operating margin of 33.1 % and profit margin of 23.3 % are the highest among the three, indicating superior cost control and the ability to translate revenue into earnings. However, RCL’s larger size also brings higher exposure to macro‑economic swings in discretionary travel, and its revenue growth of 5.2 %—while the best in the group—is only modestly ahead of NCLH’s 4.7 %.
The price‑to‑earnings (P/E) multiple for RCL sits at 18.8, noticeably above CCL’s 14.4 and NCLH’s 14.8. This premium suggests that investors are pricing in RCL’s stronger margins, more diversified fleet, and potentially better brand positioning, but it also implies higher expectations for future earnings growth. In a sector where earnings can be volatile, the elevated P/E could be a risk if RCL fails to sustain its margin advantage or if travel demand softens.
When comparing growth and profitability, RCL leads on both fronts. Its 5.2 % revenue growth outpaces CCL’s 3.3 % and is slightly ahead of NCLH’s 4.7 %. More importantly, RCL converts a larger share of that revenue into profit, with a profit margin more than double CCL’s 10.1 % and over three times NCLH’s 6.8 %. The operating margin gap (33.1 % vs. 27.9 % for CCL and 25.5 % for NCLH) reinforces RCL’s operational efficiency.
Stock performance to date reflects these fundamentals. RCL’s year‑to‑date return of 23.31 % outstrips CCL’s 11.4 % and starkly contrasts with NCLH’s –20.76 % decline, indicating stronger market confidence in RCL’s outlook. Nonetheless, investors should weigh the higher valuation against the competitive pressures of a capital‑intensive industry and monitor whether RCL can maintain its margin edge while navigating potential headwinds such as fuel price volatility and regulatory changes.
Year-to-Date Performance

- YTD Performance:
- RCL: +23.31%
- CCL: +11.40%
- NCLH: -20.76%
Risk & Reward
Bullish Case
- Operating margin of 33.1% outperforms industry peers, indicating strong cost control.
- Revenue growth of 5.2% combined with 7.45% stock rally shows momentum.
- 2027‑28 Caribbean expansion adds 2 million cabin nights, boosting future revenue pipeline.
- Free cash flow turnaround accelerates, providing runway for dividend hikes and debt reduction.
Bearish Case
- P/E of 18.8 suggests valuation may be stretched versus historical cruise averages.
- Higher fuel and labor costs could compress profit margin below 20% next year.
- Booking surge at competitor NCLH may divert high‑value passengers from RCL itineraries.
- Debt load remains elevated; interest‑rate hikes could strain cash‑flow sustainability.
What to Watch
Short-term (1-2 weeks):
- Track next day’s earnings call transcript for updated 2024 guidance and cash flow outlook.
- Watch booking trends for Q4 2024 sailings on Caribbean itineraries amid expansion buzz.
- Monitor fuel price movements impacting operating margin assumptions in upcoming investor presentations.
- Observe any analyst upgrades/downgrades following recent 7.45% price surge today.
Medium-term (1-3 months):
- Assess progress on 2027‑28 Caribbean fleet expansion and its impact on capacity utilization.
- Track loyalty program enrollment growth as a leading indicator of repeat‑guest demand.
- Watch free cash flow trends after turnaround, focusing on runway for debt reduction.
- Evaluate competitive pricing pressure from NCLH’s booking surge and its effect on RCL yields.
Disclaimer: This analysis is for informational and educational purposes only and should not be considered investment advice. The information presented is based on publicly available data and represents the author’s analysis as of December 11, 2025. Stock prices are volatile and past performance does not guarantee future results. Always conduct your own research and consult with a qualified financial advisor before making investment decisions. The author may or may not hold positions in the securities discussed.

Leave a comment