🔥 Today’s Top Gainer Analysis (RCL): View Full Analysis →
📋 Table of Contents
Market Overview

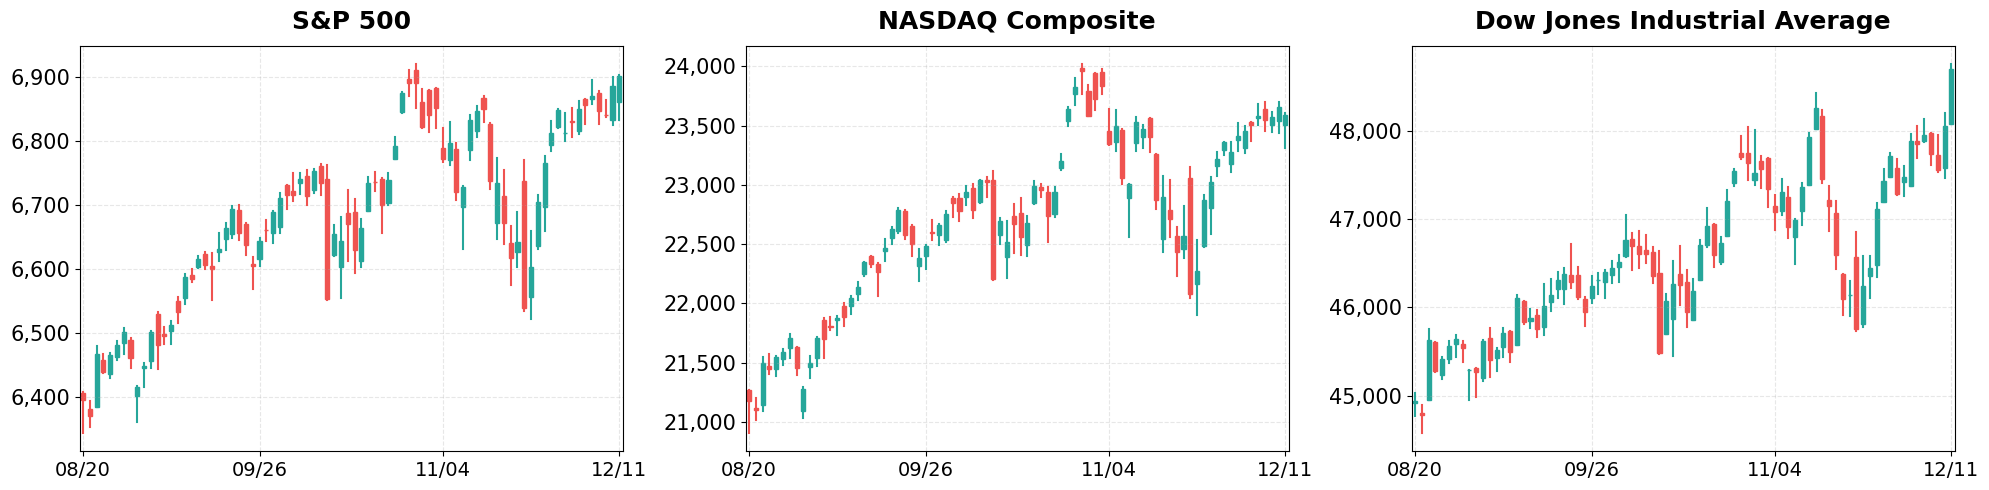
U.S. equity markets posted mixed results on December 11, 2025, as investors weighed earnings beats in the industrial sector against a pullback in technology shares.
The Dow Jones Industrial Average surged 1.34% to 48,704.01, propelling the broader market higher, while the S&P 500 added a modest 0.21% to close at 6,901.00.
Conversely, the Nasdaq Composite slipped 0.25% to 23,593.86, reflecting continued pressure on growth‑oriented stocks amid elevated valuation concerns.
- Dollar Index moved from 98.79 to 98.33 (-0.46%).
- Gold Futures moved from 4196.40 to 4303.20 (+2.55%).
- VIX moved from 15.77 to 15.06 (-4.50%).
Today’s sector performance shows the following movements:

Market News Highlights
The equity market posted a dramatic rally on the trading day, with the Dow Jones Industrial Average climbing roughly 650 points to a new record and the S&P 500 breaking the 6,900 barrier for the first time. The surge was anchored by the Federal Reserve’s unexpected rate cut and Chairman Powell’s “constructive” commentary, which reassured investors that monetary policy will remain accommodative without surprising shocks. This optimism lifted broad‑based sectors, particularly consumer discretionary and industrials, and pushed the Dow toward its highest intraday level of the year.
Despite the overall bullish tone, technology and semiconductor names faced headwinds. Oracle’s shares plunged after analysts flagged an emerging AI‑valuation bubble, suggesting that hype may be outpacing sustainable earnings growth. Meanwhile, Broadcom’s post‑close earnings are poised to test market sentiment further, as investors await clarity on the chip maker’s revenue outlook and margin trajectory. The mixed earnings narrative highlights a divergence where growth‑oriented stocks remain vulnerable even as macro‑policy supports the broader market.
In the private‑equity arena, an Apollo executive discussed optimal exit timing, underscoring that capital‑raising cycles and market liquidity will influence deal flow in the coming months. While this discussion does not directly move public indices, it signals that large institutional investors are closely monitoring the current rally’s durability and may adjust allocation strategies as the Fed’s stance evolves.
Referenced Articles
- Stock market today: Dow jumps 650 points to post record, S&P 500 climbs above 6,900 for first time
- Earnings live: Oracle stock dives on AI bubble concerns. Broadcom results after the close offer the next test.
- When do you exit a private equity investment? Apollo exec. explains
- Why Powell’s ‘constructive’ comments fueled stock market gains
- Stock market today: Dow surges, S&P 500 rallies near record as Fed cuts rates, Powell offers no ‘surprises’
Index Performance
S&P 500 (+0.21%)
The modest gain was driven by strength in energy and consumer discretionary stocks, which offset weakness in the tech sector. Volume was moderate, suggesting a tentative optimism among traders.
NASDAQ Composite (-0.25%)
Technology names led the decline, with the Nasdaq falling 60.29 points as investors reacted to mixed guidance from major chip makers. The broader sell‑off was accentuated by a lower‑than‑expected performance in biotech, adding to the downward momentum.
Dow Jones Industrial Average (+1.34%)
Industrial heavyweights such as Caterpillar and UnitedHealth posted robust earnings, lifting the Dow by 646.26 points. The rally was further supported by a surge in financials, marking the most sizable point gain among the major indices today.
Top Movers
Top Gainers

- RCL (+7.45%)
- NCLH (+6.76%)
- V (+6.12%)
Top Losers
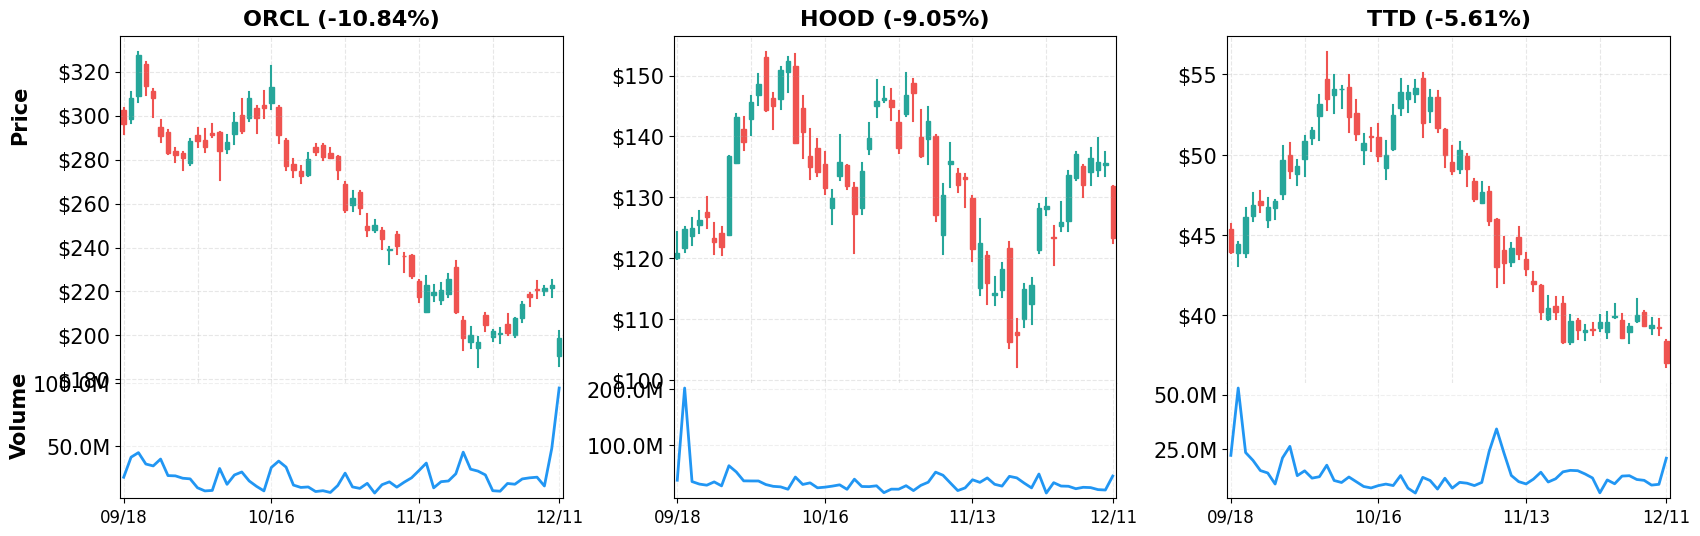
- ORCL (-10.84%)
- HOOD (-9.05%)
- TTD (-5.61%)
Magnificent 7
Overview
Performance Comparison: Magnificent 7 vs Major Indices
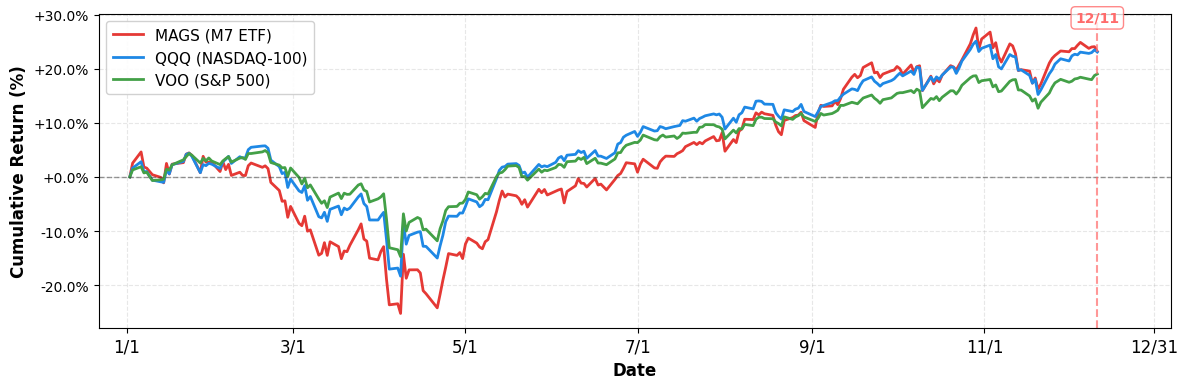
- YTD Performance:
- S&P 500 (VOO): +19.02%
- NASDAQ-100 (QQQ): +23.07%
- Magnificent 7 (MAGS): +23.19%
M7 Total Market Capitalization

- YTD Market Cap Change:
- $16.05T (1/1) → $19.29T (current), +20.19%
1. AAPL
Price: $278.03 (-0.27%)
- UBS Reiterates Neutral on Apple (AAPL) as App Store Growth Slows
- How Investors May Respond To Walt Disney (DIS) Adding Ex-Apple COO Jeff Williams To Its Board
- Jim Cramer on Apple: “Bulls Like Me Were Considered Dreamers or Even Heretics”
2. AMZN
Price: $230.28 (-0.65%)
- Guggenheim Initiates Coverage of Amazon.com (AMZN) with “Buy” Rating and $300 Price Target
- Rivian announces $2,500 Autonomy+ self-driving upgrade, reveals new AI chip to keep pace with rivals
- Elon Musk declares early victory over $45 billion rival
3. GOOGL
Price: $312.43 (-2.43%)
- Alphabet Just Did Something It Hasn’t Done in 7 Years. Time to Buy?
- OpenAI unveils GPT-5.2 to compete with Google’s Gemini 3
- Google Stock Dips Amid OpenAI Model Upgrade In Leadership Battle
4. META
Price: $652.71 (+0.40%)
- Nebius Group N.V. (NBIS) Co-Founder Sees Huge AI Demand Ahead Backed by Mega Microsoft, Meta Deals
- Bullish Analyst Sentiment on Meta Platforms (META) Amid AI Wearables Acquisition and Next-Generation Hardware Plans
- Oracle made a $300 billion bet on OpenAI. It’s paying the price.
5. MSFT
Price: $483.47 (+1.03%)
- Oracle stock sinks as market perceives ‘significant risk’ on debt
- Apollo CEO says some AI fortunes may be lost
- Sector Update: Consumer Stocks Rise Late Afternoon
6. NVDA
Price: $180.93 (-1.55%)
- If Google wins AI race, Nvidia is ‘in trouble,’ says author of Jensen Huang biography
- Better Artificial Intelligence (AI) Stock for 2026: Nvidia or AMD?
- U.S. Approves NVIDIA’s (NVDA) H200 Processor Exports to China, CEO Flags China’s AI Infrastructure Advantage
7. TSLA
Price: $446.87 (-1.02%)
- Rivian Chooses Different Path Than Tesla; Adds LiDAR To Autonomy Platform
- 3 Things That Need to Happen for Tesla To Double From Here
- Rivian announces $2,500 Autonomy+ self-driving upgrade, reveals new AI chip to keep pace with rivals
Disclaimer: This market briefing is for informational and educational purposes only and should not be considered investment advice. The information presented is based on publicly available data and represents the author’s analysis as of December 11, 2025. Stock prices are volatile and past performance does not guarantee future results. Always conduct your own research and consult with a qualified financial advisor before making investment decisions. The author may or may not hold positions in the securities discussed.

Leave a comment