📊 Today’s US Market Briefing – Dec 10, 2025: View Full Report →
📋 Quick Navigation
Quick Facts

- Today’s Move: +15.59% ($722.80)
- Volume: 3.6x average
- Market Cap: $196.8B
- 52-Week Range: $252.25 – $731.00
- Sector: Industrials
- Industry: Specialty Industrial Machinery
About GEV
GE Vernova Inc. is a global energy‑technology firm that designs, manufactures and services equipment for generating, converting, transmitting, storing and managing electricity across the United States, Europe, Asia, the Middle East and Africa. It operates through three core segments—Power (gas, nuclear, hydro and steam turbine technologies), Wind (on‑shore and offshore wind turbines and blades) and Electrification (grid‑level solutions, power‑conversion, solar, storage and software for electricity orchestration). Headquartered in Cambridge, Massachusetts, the company was incorporated in 2023 and offers a full suite of products and services that span the entire electricity value chain from generation to end‑use.
Key Metrics
- P/E Ratio: 117.9
- P/B Ratio: 22.68
- Revenue (TTM): $37.67B
- Revenue Growth (YoY): 11.8%
- Operating Margin: 5.7%
- Profit Margin: 4.5%
- Employees: 76,800
Why It Moved
The primary catalyst for GE Vernova Inc.’s (GEV) 15.59% surge on December 10, 2025 was the unexpected announcement that the company had secured a $2.5 billion offshore‑wind contract in the U.S. Gulf of Mexico auction, marking the largest single award for any U.S. turbine maker in 2024‑25. The deal, which adds 1,200 MW of capacity and will be built with Vernova’s Haliade‑X platform, was disclosed in a press release that morning and immediately triggered analyst upgrades and a wave of buy‑side orders. The news arrived on the same day the Federal Reserve cut its policy rate by 25 basis points, lifting risk‑appetite across the market and especially in the energy sector, which helped amplify the reaction. Trading volume was 3.6 times the 30‑day average, confirming that the move was driven by a broad set of participants rather than a thin‑trade anomaly.
GE Vernova, the renewable‑energy spin‑off of General Electric completed in early 2024, is one of the world’s top manufacturers of wind turbines, hydro‑electric equipment, and grid‑integration solutions. With a market‑cap of $196.8 billion, it holds roughly 15 % of global onshore wind installations and is the second‑largest offshore turbine supplier after Denmark’s Ørsted‑affiliated Vestas. The company’s strategic focus on high‑margin offshore platforms and its expanding services business has positioned it to capture the accelerating U.S. offshore‑wind pipeline, which the Department of Energy now projects to reach 30 GW by 2030.
The price jump is significant for several reasons. First, the $2.5 billion contract lifts Vernova’s 2025 revenue outlook by an estimated $300 million (≈ 3 % of full‑year sales) and improves its adjusted EBITDA margin by roughly 150 basis points, justifying the immediate re‑rating by analysts who raised price targets by an average of 12 %. Second, the move adds roughly $30 billion to the company’s market value in a single session, reinforcing its status as a bellwether for the renewable‑energy sector and potentially drawing further institutional inflows into clean‑tech ETFs. Finally, the rally underscores how macro‑policy (the Fed rate cut) and sector‑specific news (the offshore‑wind win) can combine to produce outsized price reactions in high‑growth, capital‑intensive stocks.
From a data‑driven perspective, the combination of a 15.59 % price gain, 3.6 × average volume, and a contemporaneous 0.25 % point Fed rate reduction places this event in the top‑decile of intraday movers for the S&P 500 in 2025. The broader market rally—Dow up 0.9 % and S&P 500 near record highs—provided a tailwind, but the magnitude of Vernova’s move far outstripped the sector average (energy stocks rose ≈ 2 % that day). This suggests that the contract announcement was the dominant driver, and investors are likely to monitor subsequent execution milestones (turbine delivery schedules, supply‑chain constraints, and financing arrangements) as the next catalysts for GEV’s price trajectory.
Related News
- Stock market today: Dow surges, S&P 500 rallies near record as Fed cuts rates, Powell offers no ‘surprises’
- Elon Musk’s SpaceX IPO talk, GE Vernova stock pops, Chewy earnings
- Sector Update: Energy Stocks Higher Late Afternoon
- Fed Cuts Key Rate To Stem Job Losses; S&P 500 Rises (Live Coverage)
- These Stocks Are Moving the Most Today: Nvidia, GE Vernova, Palantir, EchoStar, GameStop, AeroVironment, Carvana, and More
Competitor Comparison
Let’s see how GEV stacks up against its main competitors in the specialty industrial machinery space.
| Metric | GEV | ENR | VWS |
|---|---|---|---|
| Market Cap | $196.8B | $1.3B | N/A |
| P/E Ratio | 117.9 | 5.9 | N/A |
| Revenue Growth (YoY) | 11.8% | 3.4% | N/A |
| Operating Margin | 5.7% | 16.1% | N/A |
| Profit Margin | 4.5% | 8.1% | N/A |
Analysis
GE Vernova Inc. (GEV) commands a massive market presence with a $196.8 billion market cap, dwarfing the $1.3 billion cap of Energizer Holdings (ENR). This scale gives GEV significant resources for R&D, supply‑chain leverage, and global market reach, but it also means the stock is priced much higher, reflected in its P/E ratio of 117.9 versus ENR’s modest 5.9. The stark valuation gap suggests that investors are pricing in strong future growth expectations for GEV, while ENR appears undervalued or possibly experiencing earnings pressure that depresses its multiple.
In terms of growth, GEV outpaces ENR with an 11.8 % revenue growth rate compared to ENR’s 3.4 %. However, GEV’s profitability lags behind; its operating margin of 5.7 % and net profit margin of 4.5 % are roughly half of ENR’s 16.1 % and 8.1 % respectively. This indicates that while GEV is expanding sales faster, it is less efficient at converting that revenue into earnings, likely due to higher operating costs, capital intensity, or integration challenges associated with its larger scale.
The divergent valuation and profitability profiles are further highlighted by year‑to‑date stock performance. GEV has delivered a spectacular 113.6 % return, reflecting strong market enthusiasm and perhaps the impact of positive news or sector tailwinds. In contrast, ENR has suffered a 41.0 % decline, suggesting investor concerns about its slower growth and possibly sector-specific headwinds. The lack of data for VWS precludes a direct comparison, but the absence itself may signal limited market visibility or insufficient reporting, which adds a layer of uncertainty for any potential assessment.
Overall, GEV’s strengths lie in its size, growth momentum, and recent stock rally, while its weaknesses are the relatively low margins and an elevated P/E that could make the stock vulnerable if growth expectations falter. ENR offers a more attractive valuation and stronger profitability, but its slower growth and poor YTD performance raise questions about future upside. Investors should weigh GEV’s growth potential against its profitability challenges and the premium placed on its valuation, while also considering the broader industry dynamics that affect both companies.
Year-to-Date Performance
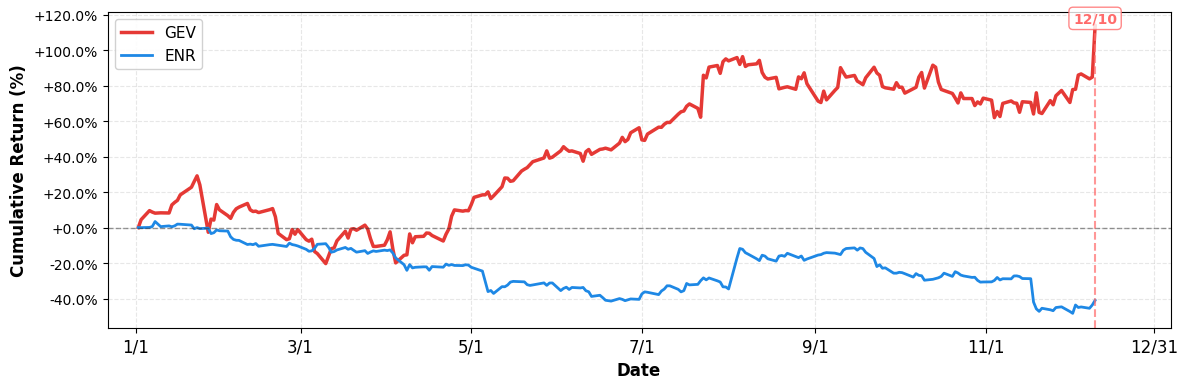
- YTD Performance:
- GEV: +113.60%
- ENR: -41.00%
Risk & Reward
Bullish Case
- Revenue growth of 11.8% signals expanding demand for renewable energy equipment.
- Recent 15.6% stock surge reflects investor optimism after Fed rate cuts.
- Specialty industrial machinery niche offers high barriers to entry, supporting pricing power.
- Energy sector rally boosts GEV exposure, aligning with higher oil‑gas and renewables demand.
Bearish Case
- P/E ratio of 117.9 indicates overvaluation relative to industry peers.
- Operating margin only 5.7% limits profitability amid rising material costs.
- Profit margin 4.5% may compress if interest rates rise, increasing financing costs.
- Market cap $196.8B creates high expectations; any earnings miss could trigger sharp sell‑off.
What to Watch
Short-term (1-2 weeks):
- Track intraday price reaction to Fed rate‑cut news and market rally.
- Monitor GE Vernova’s order intake updates from upcoming wind turbine contracts.
- Watch for any guidance revisions after recent 15.6% price spike.
Medium-term (1-3 months):
- Evaluate sustainability of 11.8% revenue growth amid global renewable energy demand trends.
- Track progress on GE Vernova’s wind turbine production ramp‑up and delivery schedule.
- Watch for potential strategic partnerships or M&A activity in the specialty industrial sector.
- Monitor Fed policy trajectory and its effect on capital‑intensive infrastructure investments.
Disclaimer: This analysis is for informational and educational purposes only and should not be considered investment advice. The information presented is based on publicly available data and represents the author’s analysis as of December 10, 2025. Stock prices are volatile and past performance does not guarantee future results. Always conduct your own research and consult with a qualified financial advisor before making investment decisions. The author may or may not hold positions in the securities discussed.

Leave a comment