🔥 Today’s Top Gainer Analysis (PSKY): View Full Analysis →
📋 Table of Contents
Market Overview
On Monday, December 08, 2025, equity markets opened lower amid fresh concerns over tightening monetary policy and a modest dip in consumer confidence. The S&P 500 slipped to 6,846.51, the Nasdaq fell to 23,545.90, and the Dow Jones slipped further to 47,739.32, reflecting a broadly bearish tone across major sectors. Investors also priced in a potential slowdown in global trade, which kept risk‑off sentiment elevated throughout the session.
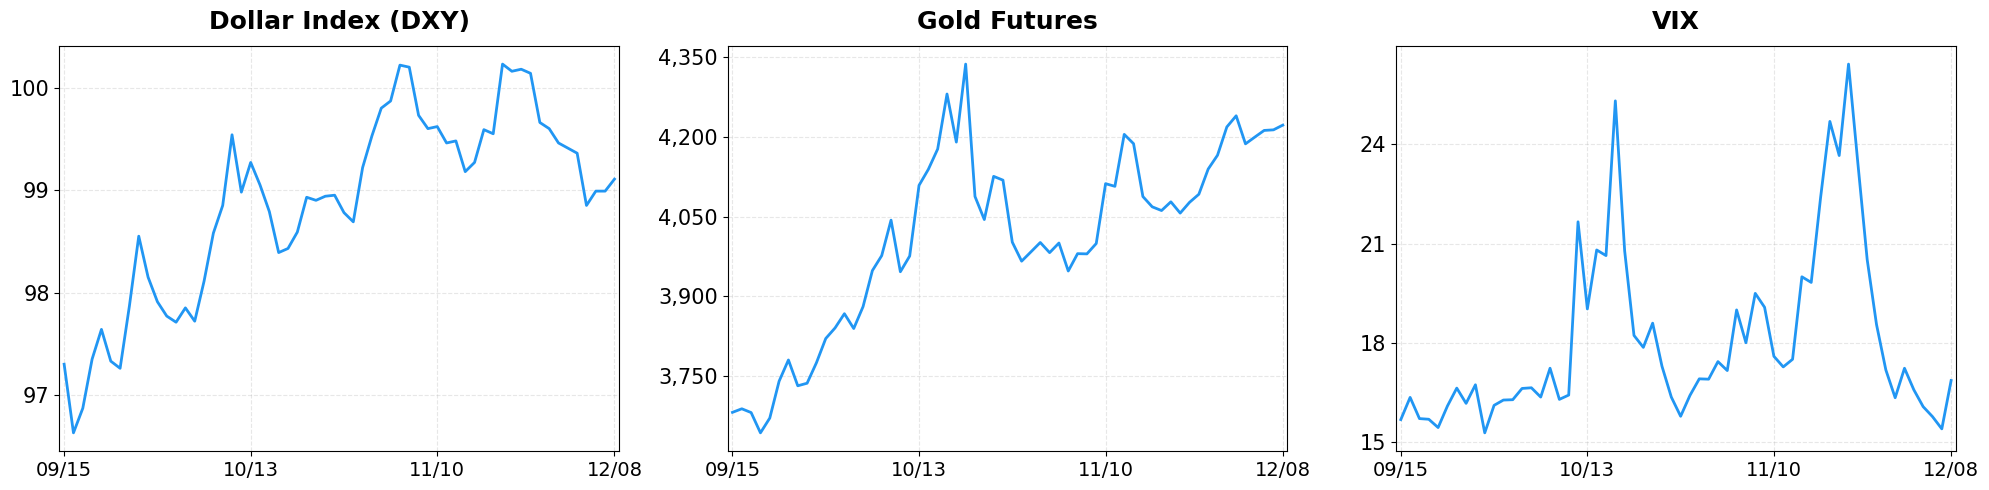
- Dollar Index moved from 98.99 to 99.11 (+0.12%).
- Gold Futures moved from 4212.90 to 4221.80 (+0.21%).
- VIX moved from 15.41 to 16.87 (+9.47%).
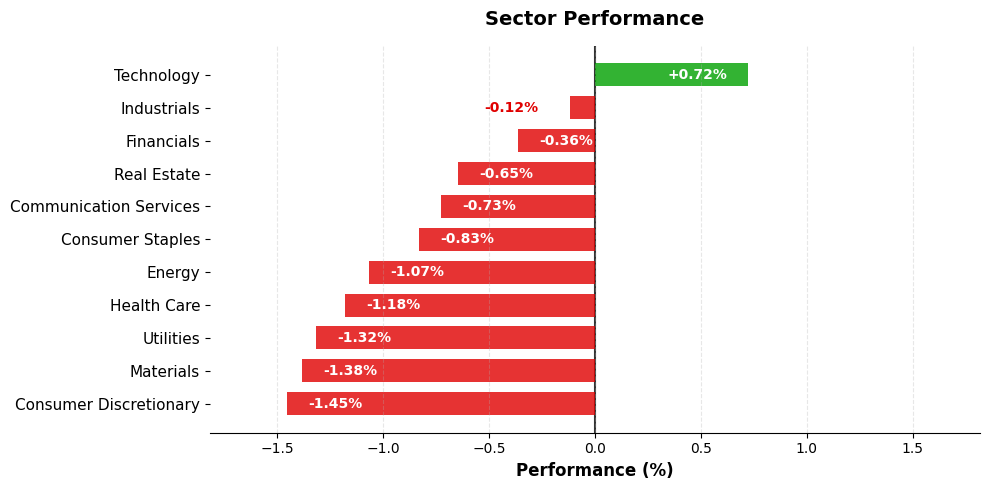
Today’s sector performance shows the following movements:
Market News Highlights
U.S. equities opened lower on Monday as the Dow Jones Industrial Average, S&P 500, and Nasdaq Composite all slipped, driven primarily by a sharp pullback in Netflix shares after reports of a stalled partnership deal. The streaming giant’s decline weighed on the broader tech sector, even as Nvidia posted gains on its latest earnings beat, providing a modest counterbalance. The mixed performance underscores the market’s sensitivity to headline‑driven earnings volatility and the ongoing rotation between growth‑oriented names and more defensive stocks.
Meanwhile, Carvana experienced a pronounced rally after its announcement of inclusion in the S&P 500, a move that typically triggers index‑fund buying and boosts liquidity. The news coincided with a strategic decision by a major investment firm to increase its Bitcoin exposure, a factor that helped keep the cryptocurrency market buoyant, with Bitcoin holding above the $90,000 level. Conversely, Ferrari saw a downgrade, adding pressure to the luxury auto segment. Investors are also keeping a close eye on the Federal Reserve’s upcoming policy decision, which could influence risk appetite across equities and fixed income as markets hover near record highs.
Overall, the confluence of sector‑specific catalysts—Netflix’s deal uncertainty, Carvana’s index inclusion, and Nvidia’s earnings strength—combined with macro‑level considerations surrounding monetary policy and crypto sentiment, suggests a near‑term environment of heightened volatility. Market participants are likely to adjust positioning ahead of the Fed’s decision, with particular focus on tech and discretionary sectors.
Referenced Articles
- Stock market today: Dow, S&P 500, Nasdaq fall as Netflix skids on deal drama, Nvidia rises
- Carvana stock surges on S&P 500 inclusion, Ferrari downgraded
- Carvana to join S&P 500, Strategy buys more bitcoin
- Crucial Fed decision looms as stocks fly high near records: What to watch this week
- Top Cryptocurrencies Mixed; Bitcoin Holds Above $90,000
Index Performance
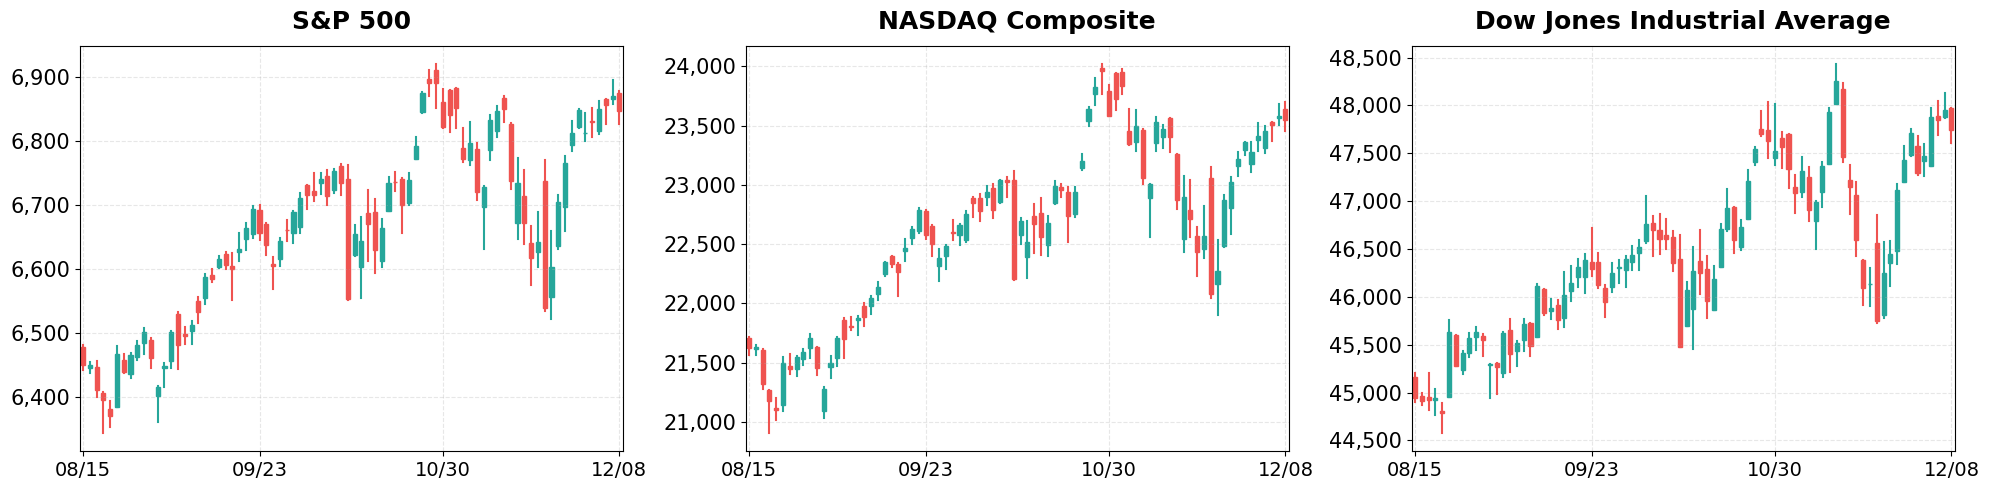
S&P 500 (-0.35%)
The benchmark lost 23.89 points, or 0.35%, as technology and financial stocks led the decline, pulling the index lower across the board. Volume was moderate, suggesting that the pullback may be a short‑term reaction to the latest Federal Reserve commentary and could be contained.
NASDAQ Composite (-0.14%)
The Nasdaq shed 32.23 points, down 0.14%, with the chip sector under pressure after mixed earnings reports and a modest sell‑off in growth‑oriented names. Despite the dip, the index remains above its 200‑day moving average, indicating underlying resilience and a still‑healthy appetite for tech exposure.
Dow Jones Industrial Average (-0.45%)
The Dow dropped 215.67 points, a 0.45% decline, driven primarily by weakness in industrials and consumer discretionary names, as investors trimmed exposure to cyclical stocks. The broader market breadth was thin, with only a handful of stocks posting gains, underscoring the pervasive caution among market participants.
Top Movers
Top Gainers
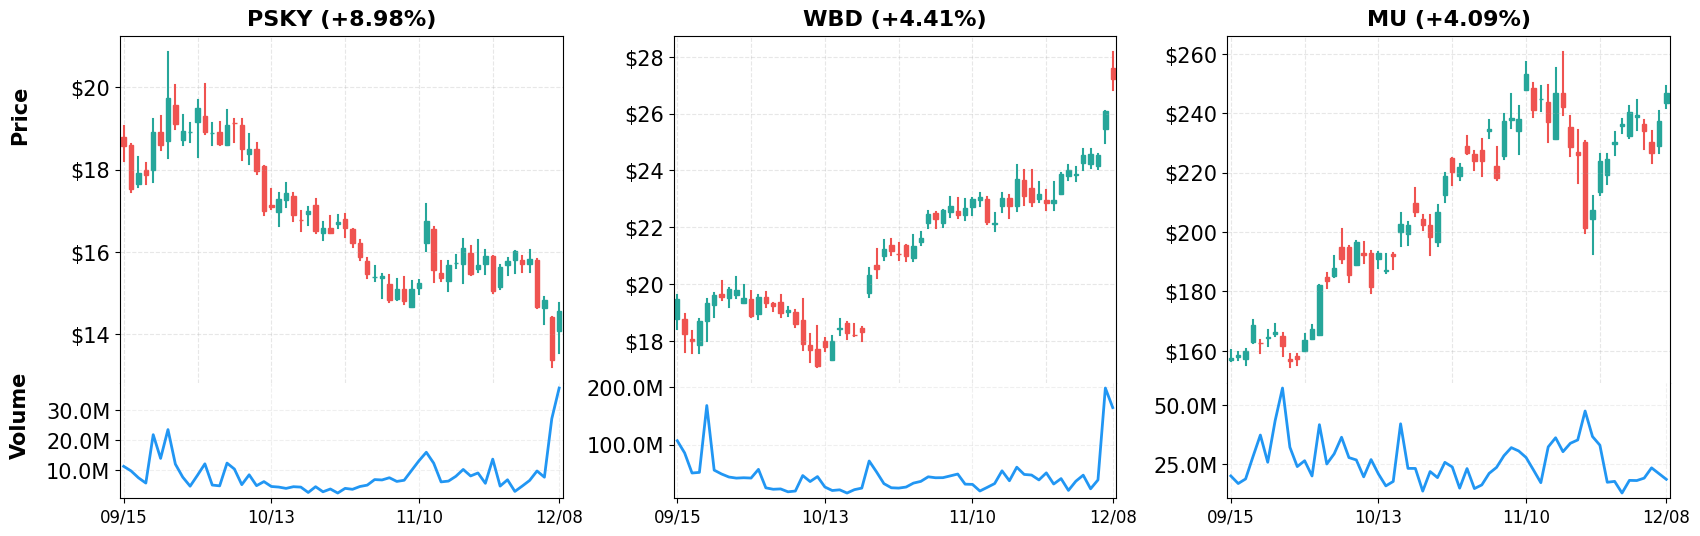
- PSKY (+8.98%)
- WBD (+4.41%)
- MU (+4.09%)
Top Losers
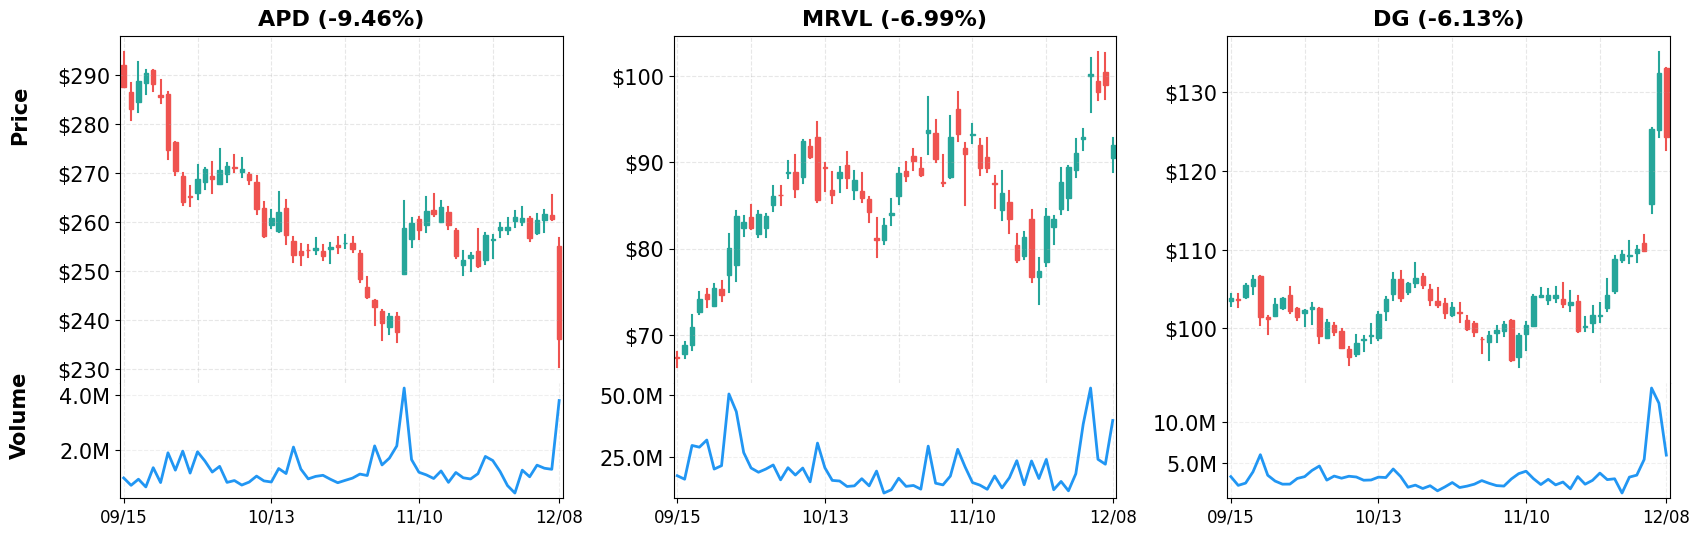
- APD (-9.46%)
- MRVL (-6.99%)
- DG (-6.13%)
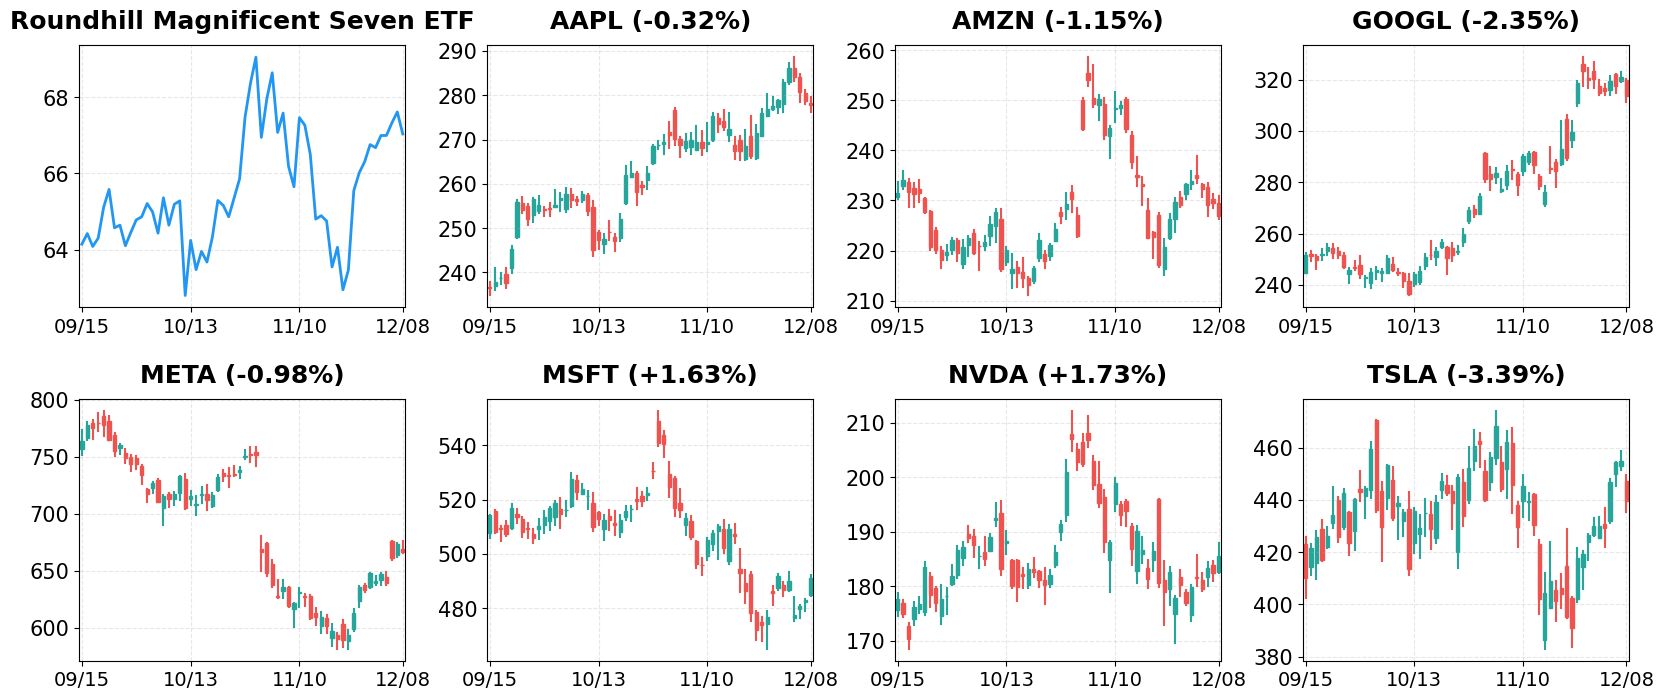
Magnificent 7
Overview
Performance Comparison: Magnificent 7 vs Major Indices
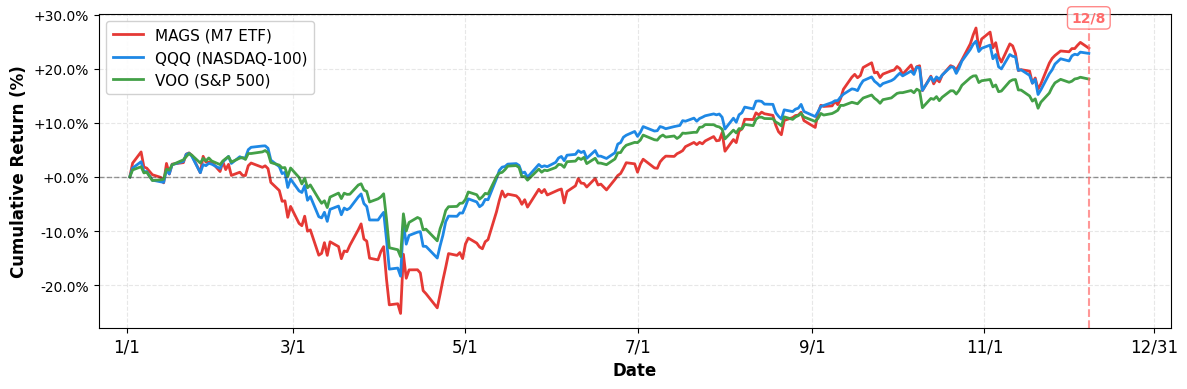
- YTD Performance:
- S&P 500 (VOO): +18.07%
- NASDAQ-100 (QQQ): +22.81%
- Magnificent 7 (MAGS): +23.78%
M7 Total Market Capitalization
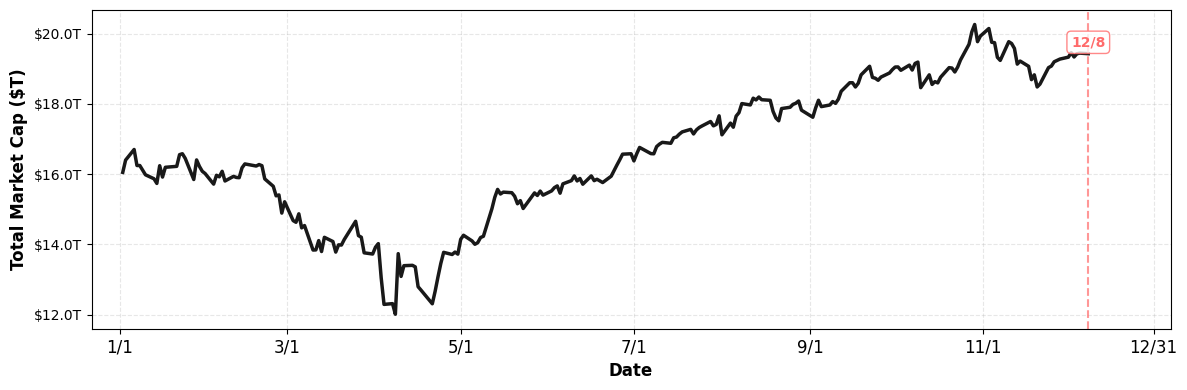
- YTD Market Cap Change:
- $16.05T (1/1) → $19.43T (current), +21.06%
1. AAPL
Price: $277.89 (-0.32%)
- Apple’s chip chief reportedly ‘not leaving’: A closer look
- Netflix, Apple, Five Below: Top analyst calls today
- Apple Just Dropped a Global Fitness Bombshell–And It’s Not What You Think
2. AMZN
Price: $226.89 (-1.15%)
- Nvidia stock rises on report Trump administration will greenlight sale of H200 chips to China
- Quantum Computing Outlook Shines: 2 Stocks to Watch Heading into 2026
- Why Marvell Technology Sank Today
3. GOOGL
Price: $313.72 (-2.35%)
- Oura vs Big Tech: The ring taking on Apple, Google & OpenAI
- Market Chatter: Google Plans 2026 Launch of Next-Gen AI Glasses Featuring Gemini
- Alphabet’s Google Unit Launches Updates for Galaxy XR
4. META
Price: $666.80 (-0.98%)
- Meta Platforms Stock Jumps on Metaverse Spending Cuts. Here’s Why the Growth Stock Is a Screaming Buy Before 2026
- Nvidia stock rises on report Trump administration will greenlight sale of H200 chips to China
- Why these 2 stocks have shockingly blown away Nvidia
5. MSFT
Price: $491.02 (+1.63%)
- Nvidia stock rises on report Trump administration will greenlight sale of H200 chips to China
- Carvana to join S&P 500, Strategy buys more bitcoin
- Why these 2 stocks have shockingly blown away Nvidia
6. NVDA
Price: $185.57 (+1.73%)
- Stock market today: Dow, S&P 500, Nasdaq fall as Netflix skids on deal drama, Nvidia rises
- Apple exec. staying, Nvidia & SoftBank eye Skild AI: Reports
- Why these 2 stocks have shockingly blown away Nvidia
7. TSLA
Price: $439.58 (-3.39%)
- Tesla stock drops as new Morgan Stanley analyst downgrades shares, citing valuation
- Morgan Stanley Hands Tesla Stock A New Rating, Sees Musk Hitting This Many Pay Deal Milestones
- Why Tesla (TSLA) Shares Are Sliding Today
Disclaimer: This market briefing is for informational and educational purposes only and should not be considered investment advice. The information presented is based on publicly available data and represents the author’s analysis as of December 08, 2025. Stock prices are volatile and past performance does not guarantee future results. Always conduct your own research and consult with a qualified financial advisor before making investment decisions. The author may or may not hold positions in the securities discussed.

Leave a comment