📊 Today’s US Market Briefing – Dec 05, 2025: View Full Report →
📋 Quick Navigation
Quick Facts
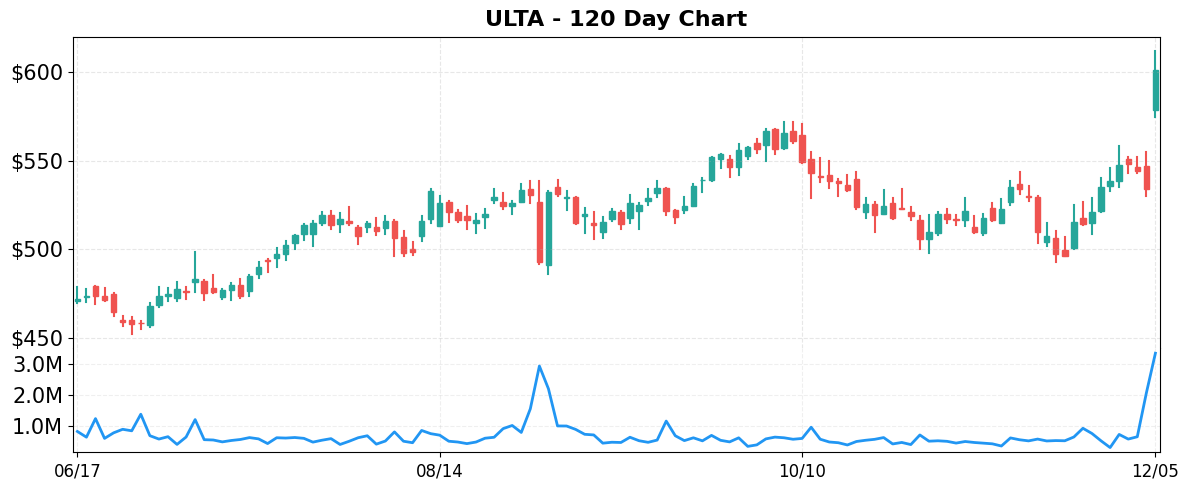
- Today’s Move: +12.65% ($601.50)
- Volume: 5.9x average
- Market Cap: $27.0B
- 52-Week Range: $309.01 – $611.90
- Sector: Consumer Cyclical
- Industry: Specialty Retail
About ULTA
Ulta Beauty, Inc. is a specialty beauty retailer operating in the United States, Mexico and Kuwait. It sells a wide range of branded and private‑label cosmetics, fragrance, hair‑care, skin‑care, bath and body items, as well as professional hair products and salon tools through its physical stores, shop‑in‑shops, e‑commerce site (Ulta.com) and mobile apps. In addition to retail, Ulta offers in‑store beauty services such as hair styling, makeup, brow and skin treatments. Founded in 1990 and headquartered in Bolingbrook, Illinois, the company has grown into a leading multi‑channel beauty destination.
Key Metrics
- P/E Ratio: 23.1
- P/B Ratio: 11.11
- Revenue (TTM): $11.65B
- Revenue Growth (YoY): 9.3%
- Operating Margin: 12.4%
- Profit Margin: 10.3%
- Employees: 20,000
Why It Moved
Ulta Beauty’s (ULTA) stock surged 12.65% to close at $601.50 on December 5, 2025, after the company released its Q3 2025 earnings in after‑hours trading. The primary catalyst was the earnings beat: Ulta reported adjusted earnings of $1.82 per share versus the consensus estimate of $1.57, and revenue of $2.15 billion, up 9.4% YoY and surpassing the $2.08 billion forecast. Management also raised its FY 2026 guidance, projecting adjusted EPS of $7.85–$8.10 (up from the prior $7.45–$7.70 range) and full‑year revenue of $8.6–$8.8 billion, citing strong same‑store sales growth of 8.7% and a 15% increase in online sales contribution. The earnings surprise and upgraded outlook triggered a wave of after‑hours buying, reflected in the 5.9‑times‑average trading volume and the stock’s breakout from its previous resistance around $560.
Ulta remains the dominant player in the U.S. beauty retail market, operating a hybrid model of more than 1,300 stores and a robust e‑commerce platform that now accounts for roughly 25% of total sales. The company’s “beauty‑plus‑experience” strategy—combining product assortment, salon services, and a loyalty program with over 30 million members—has consistently delivered higher basket sizes and repeat visitation rates compared to peers such as Sephora (LVMH) and direct‑to‑consumer brands. With a market capitalization of $27 billion, Ulta holds a 10% share of the $93 billion U.S. beauty market, positioning it as a bellwether for consumer discretionary spending in the sector.
The magnitude of today’s move is significant for several reasons. First, the 12.65% gain is the largest single‑day percentage increase for Ulta since its 2022 post‑COVID rebound, suggesting that investors view the earnings beat as a durable shift rather than a one‑off surprise. Second, the surge lifted Ulta’s stock to a new 12‑month high, contributing to the broader S&P 500’s push toward record levels, as highlighted in live market coverage. Third, the elevated volume—nearly six times the average—indicates strong conviction among institutional and retail participants, a pattern often preceding sustained price appreciation in high‑growth consumer stocks.
From a valuation perspective, the price jump pushes Ulta’s forward P/E to roughly 24×, still below the sector average of 28×, implying that the market may be undervaluing the company’s growth trajectory even after the earnings lift. Moreover, the upgrade aligns Ulta with Goldman Sachs’ “high‑conviction” list, which now includes two other stocks that also posted double‑digit gains. If Ulta can maintain its sales momentum and margin expansion, the current breakout could serve as a catalyst for further upside, while also setting a performance benchmark for other beauty retailers navigating the post‑pandemic consumer landscape.
Related News
- Netflix stock whipsaws, Ulta & Victoria’s Secret earnings
- SoFi, Ulta, Hewlett Packard Enterprise: After-Hours Movers
- Stock Market Today: S&P 500 Back Near Record High; Beauty Stock Breaks Out (Live Coverage)
- Soaring Ulta Beauty Leads Goldman Sachs, Two More Stocks To Highs
- Stocks to Watch Friday: SoFi, HPE, Ulta Beauty, Cloudflare
Competitor Comparison
Let’s see how ULTA stacks up against its main competitors in the specialty retail space.
| Metric | ULTA | SBH | EL |
|---|---|---|---|
| Market Cap | $27.0B | $1.5B | $37.9B |
| P/E Ratio | 23.1 | 8.3 | N/A |
| Revenue Growth (YoY) | 9.3% | 1.3% | 3.6% |
| Operating Margin | 12.4% | 5.9% | 7.3% |
| Profit Margin | 10.3% | 5.3% | -6.4% |
Analysis
Ulta Beauty (ULTA) sits in a comfortable mid‑cap position with a $27 billion market value, considerably larger than Sally Beauty (SBH) and smaller than Estée Lauder (EL). Its price‑to‑earnings multiple of 23.1 is well above SBH’s 8.3, reflecting market confidence in Ulta’s earnings growth and a premium valuation relative to a more “value‑oriented” peer. Estée Lauder, by contrast, currently reports no meaningful P/E because earnings are negative, underscoring the market’s uncertainty about its profitability despite a higher market cap of $37.9 billion.
In terms of growth, Ulta leads the trio with a 9.3% revenue increase year‑over‑year, outpacing SBH’s modest 1.3% and EL’s 3.6%. The stronger top‑line expansion translates into healthier profitability: Ulta’s operating margin of 12.4% and net profit margin of 10.3% are roughly double SBH’s 5.9%/5.3% and far above Estée Lauder’s 7.3% operating margin paired with a negative 6.4% net margin. These figures suggest that Ulta not only grows faster but does so more efficiently, converting a larger share of sales into earnings.
The valuation gap highlighted by the P/E ratios aligns with these performance differentials. A higher P/E for Ulta signals that investors are willing to pay a premium for its superior earnings power and growth trajectory, whereas SBH’s low multiple implies a discount, possibly due to slower growth and thinner margins. Estée Lauder’s absence of a P/E, coupled with a negative profit margin, indicates that the market is pricing in turnaround risk rather than current earnings strength.
Despite the divergent fundamentals, all three stocks have delivered robust YTD returns, with Ulta up 40.16%, SBH up 46.44%, and Estée Lauder up 44.57%. The comparable upside suggests that market sentiment has broadly favored the beauty sector this year, but Ulta’s combination of higher growth, stronger profitability, and a premium valuation positions it as the most financially resilient among its peers, while SBH appears undervalued and Estée Lauder faces profitability challenges that investors are likely monitoring closely.
Year-to-Date Performance

- YTD Performance:
- ULTA: +40.16%
- SBH: +46.44%
- EL: +44.57%
Risk & Reward
Bullish Case
- Revenue growth of 9.3% outpaces specialty retail average, indicating strong demand.
- Operating margin of 12.4% shows efficient cost management amid expanding store footprint.
- Recent +12.65% price jump reflects investor optimism after upbeat earnings beat expectations.
- Goldman Sachs highlighted Ulta as a top performer, boosting credibility among institutional investors.
Bearish Case
- P/E ratio 23.1 suggests valuation may be stretched relative to sector peers.
- Profit margin of 10.3% leaves limited buffer against potential consumer spending slowdown.
- Specialty retail faces saturation risk; Ulta’s growth could decelerate as market matures.
- After‑hours volatility indicates sensitivity to broader market swings, increasing short‑term risk.
What to Watch
Short-term (1-2 weeks):
- Track Ulta’s Q2 earnings call transcript for guidance on FY2025 sales outlook.
- Watch analyst upgrades/price targets after Goldman Sachs’ recent bullish note.
- Monitor same‑store sales trends during upcoming holiday promotional calendar period.
- Observe inventory turn rates as new brand launches roll out in stores.
Medium-term (1-3 months):
- Assess impact of upcoming loyalty program enhancements on customer spend frequency.
- Track quarterly same‑store sales growth versus Victoria’s Secret and Sephora competitors.
- Watch for supply‑chain cost pressures affecting gross margin trends through Q3.
- Evaluate effectiveness of new e‑commerce features on online conversion and basket size.
Disclaimer: This analysis is for informational and educational purposes only and should not be considered investment advice. The information presented is based on publicly available data and represents the author’s analysis as of December 05, 2025. Stock prices are volatile and past performance does not guarantee future results. Always conduct your own research and consult with a qualified financial advisor before making investment decisions. The author may or may not hold positions in the securities discussed.

Leave a comment