🔥 Today’s Top Gainer Analysis (ULTA): View Full Analysis →
📋 Table of Contents
Market Overview
On December 05, 2025, the U.S. equity markets posted modest gains across the board, buoyed by a combination of resilient earnings reports and slightly easing inflation pressures that reinforced a cautiously optimistic investor outlook. The rally was anchored by strength in both technology and industrial sectors, while defensive staples added a stabilising layer that kept the major indices firmly in positive territory. Overall, market breadth was healthy, suggesting that confidence is spreading beyond the headline‑making names.
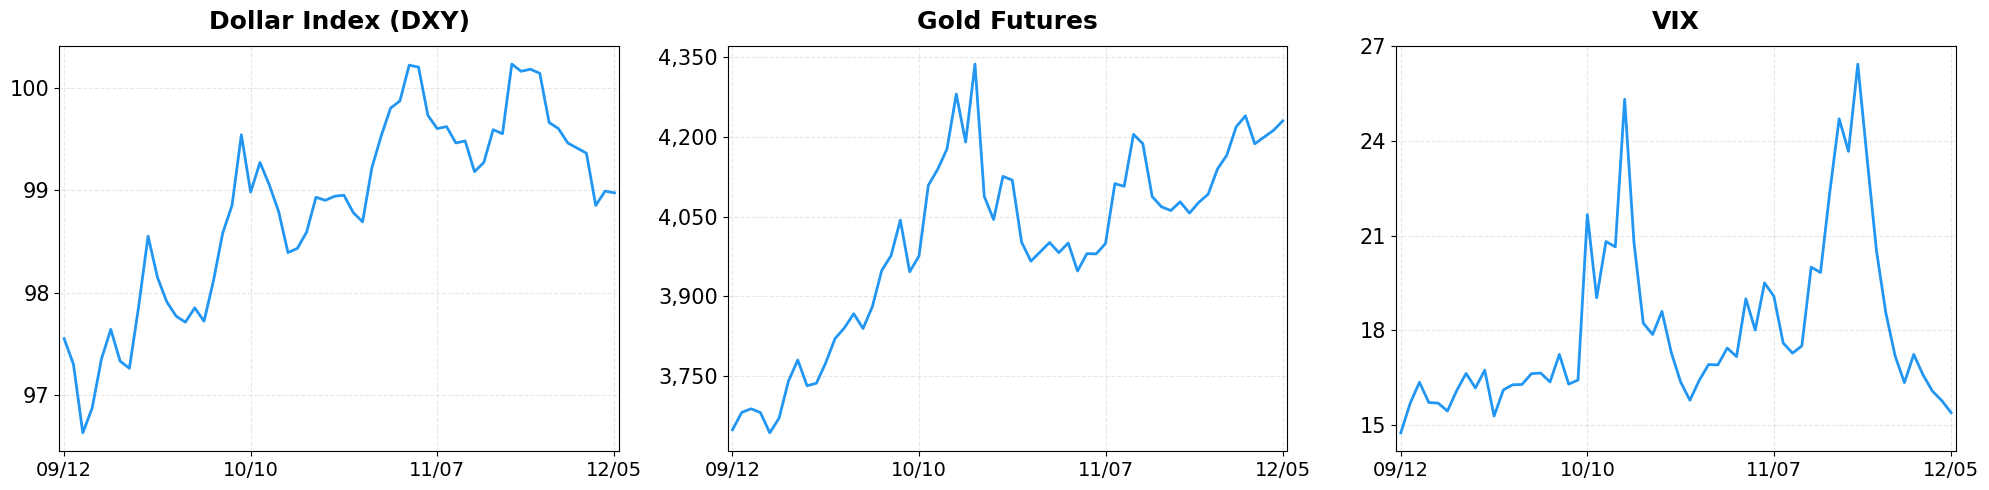
- Dollar Index moved from 98.99 to 98.97 (-0.02%).
- Gold Futures moved from 4211.80 to 4229.70 (+0.43%).
- VIX moved from 15.78 to 15.40 (-2.41%).
Today’s sector performance shows the following movements:

Market News Highlights
The equity market extended its rally for a fourth consecutive session, with the S&P 500 and Nasdaq posting modest gains as investors brace for next week’s Federal Reserve meeting. The upside momentum reflects optimism that recent inflation data may allow the Fed to adopt a more dovish stance, supporting growth‑oriented sectors while keeping defensive positions on the back‑burner. However, underlying volatility remains elevated, driven by mixed signals from the US Treasury yield curve, which continues to exhibit a flattening pattern that could foreshadow a shift in monetary policy expectations.
Commodities displayed divergent trends. Gold surged ahead of schedule, positioning itself for a weekly win as “momentum” fuels what analysts describe as a historic 2025 rally. The safe‑haven appeal of gold is amplified by the lingering uncertainty surrounding the Fed’s policy path and the broader macro environment. In contrast, the cryptocurrency market suffered a sharp pullback, with Bitcoin slipping below $90,000 and other major tokens retreating in tandem. The decline appears linked to heightened risk aversion and a re‑allocation of capital toward more traditional assets amid the same policy‑rate concerns that are influencing equities.
Overall, the market narrative on December 05, 2025 is one of cautious optimism. While equity indices benefit from the prospect of a less aggressive Fed, the flattening yield curve and the retreat in digital assets underscore the fragility of the rally. Investors are likely to monitor the Fed’s forthcoming guidance closely, as it could either cement the current upward bias or trigger a recalibration across risk assets.
Referenced Articles
- Stock market today: S&P 500, Nasdaq notch fourth day of gains with next week’s Fed meeting in focus
- Gold on pace for weekly win as ‘momentum’ drives historic 2025 rally
- Market choppiness, US yield curves, bitcoin: Trading Takeaways
- Top Cryptocurrencies Fall; Bitcoin Drops Below $90,000
- Stock Market Today: S&P 500 Back Near Record High; Beauty Stock Breaks Out (Live Coverage)
Index Performance

S&P 500 (+0.19%)
The S&P 500 closed at 6,870.40, up 13.28 points, as large‑cap equities benefitted from incremental earnings upgrades and a benign interest‑rate outlook that encouraged risk‑on positioning. Defensive sectors such as consumer staples and health care also contributed modestly, providing a balanced lift that helped sustain the index’s upward momentum.
NASDAQ Composite (+0.31%)
The tech‑heavy NASDAQ Composite rose to 23,578.13, gaining 72.99 points, reflecting robust demand for cloud services and semiconductor earnings that comfortably beat expectations. The breadth of the rally extended beyond the marquee names, indicating broader confidence in growth‑oriented companies and a willingness to re‑allocate capital into higher‑beta assets.
Dow Jones Industrial Average (+0.22%)
The Dow Jones Industrial Average finished at 47,954.99, up 104.05 points, as industrials and financials posted solid earnings and benefited from a stable macro‑economic backdrop. The modest rise underscores the index’s resilience amid ongoing geopolitical uncertainties, suggesting that core U.S. economic fundamentals continue to underpin market performance.
Top Movers
Top Gainers
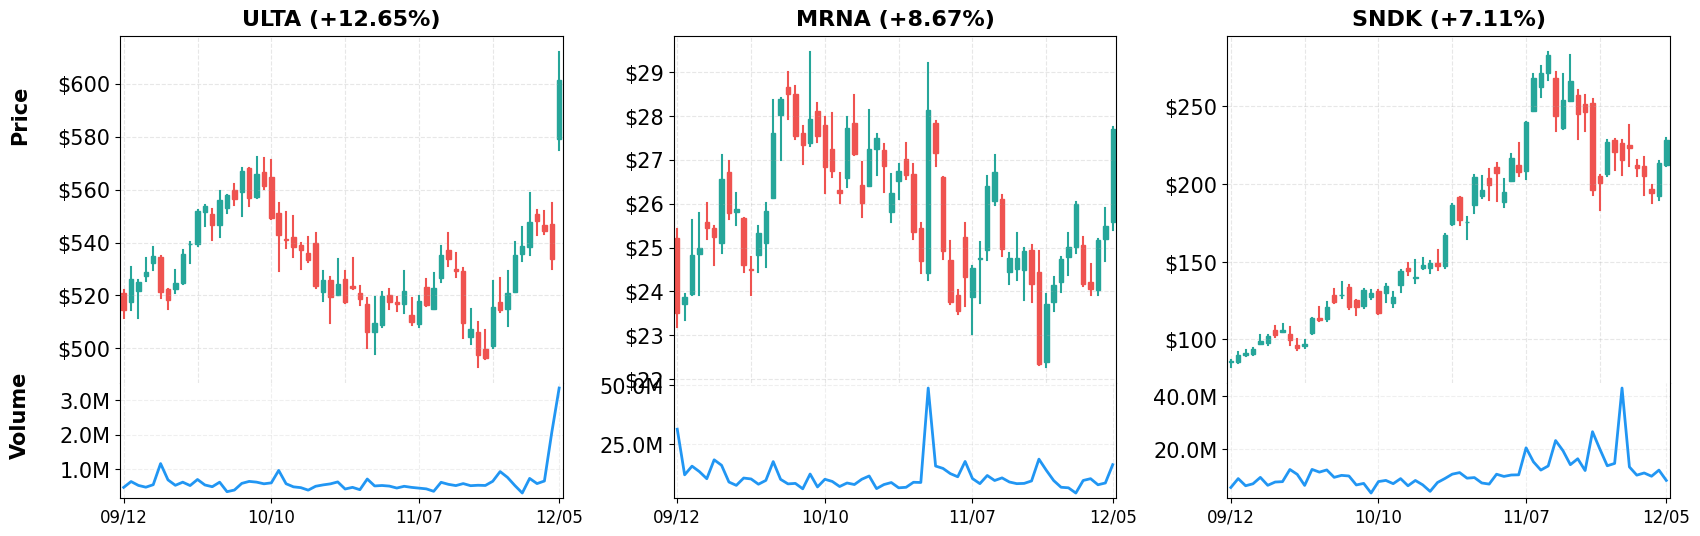
- ULTA (+12.65%)
- MRNA (+8.67%)
- SNDK (+7.11%)
Top Losers
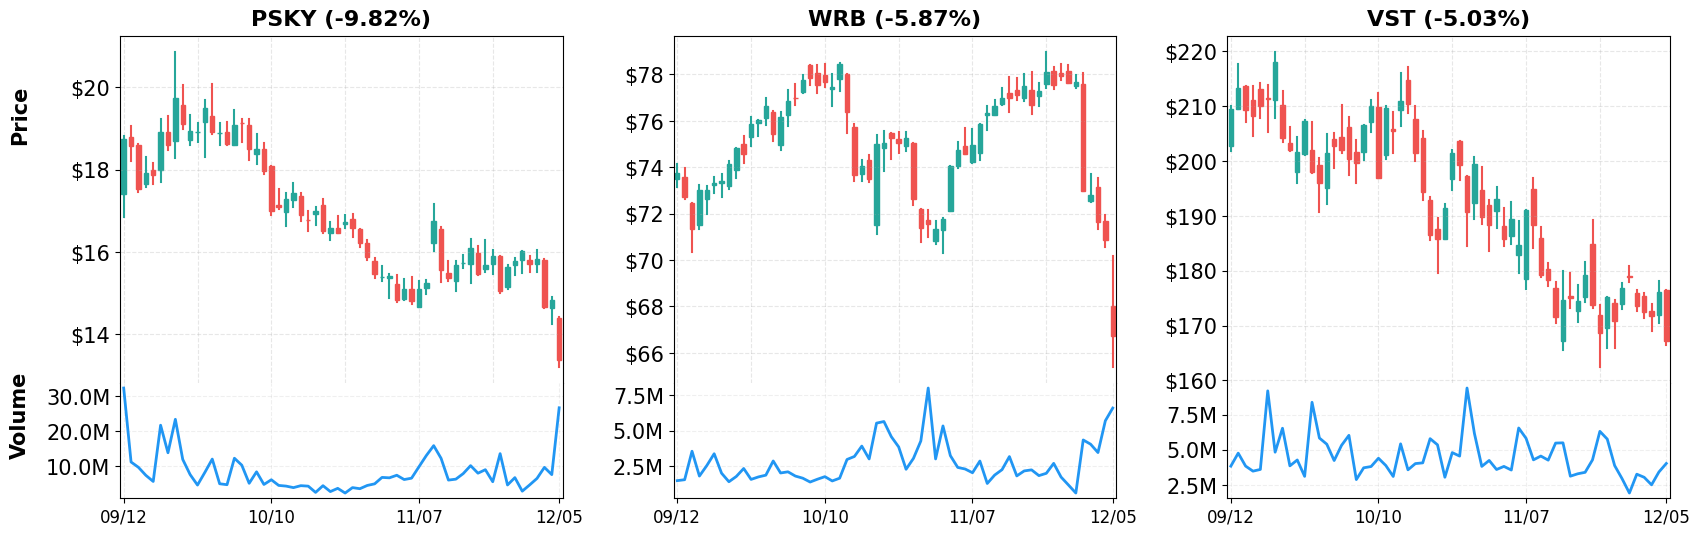
- PSKY (-9.82%)
- WRB (-5.87%)
- VST (-5.03%)
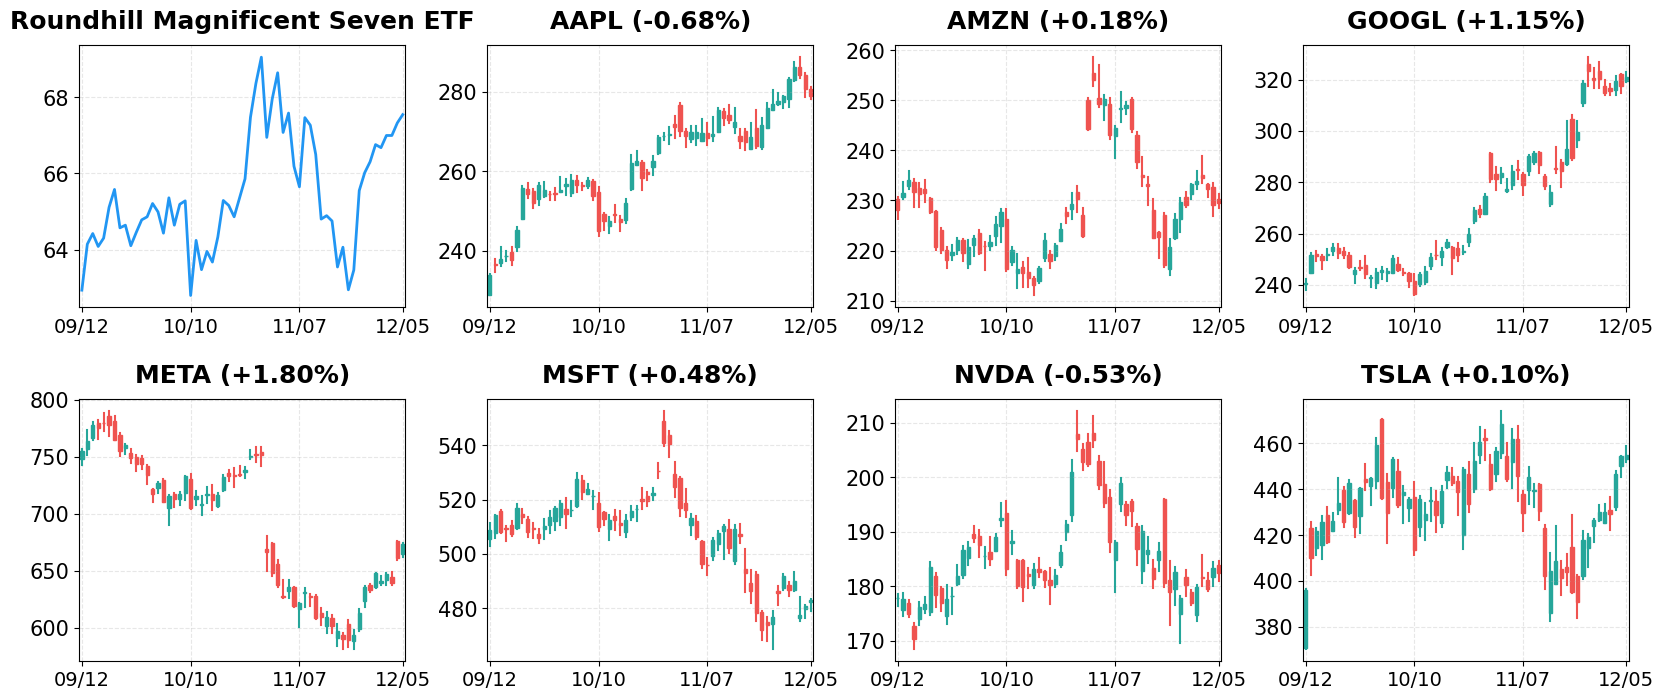
Magnificent 7
Overview
Performance Comparison: Magnificent 7 vs Major Indices

- YTD Performance:
- S&P 500 (VOO): +18.41%
- NASDAQ-100 (QQQ): +23.05%
- Magnificent 7 (MAGS): +24.72%
M7 Total Market Capitalization

- YTD Market Cap Change:
- $16.05T (1/1) → $19.45T (current), +21.18%
1. AAPL
Price: $278.78 (-0.68%)
- Netflix to acquire Warner Bros., more executive departures at Apple
- Meet the Supercharged Growth Stock That Could Join Apple, Nvidia, Microsoft, and Alphabet in the $2 Trillion Club by 2028
- Apple Made a Comeback with the iPhone 17, But Will Executive Exits Pull Down AAPL Stock?
2. AMZN
Price: $229.53 (+0.18%)
- Amazon’s Secret Weapon? New Graviton5 Chip Could Rewrite the Cloud Playbook
- Netflix–Warner Bros. deal: 6 things to keep an eye on
- Nvidia’s chips face new competition from Google, but the company’s not about to lose its edge
3. GOOGL
Price: $321.27 (+1.15%)
- Google veteran says U.S. free markets are winning after ‘genius’ idea
- Top Funds Get Googly-Eyed Over This Breakout AI Stock Not Named Nvidia Or Palantir
- Google-backed TAE Technologies forms JV with UK’s nuclear agency (Dec 2)
4. META
Price: $673.42 (+1.80%)
- Meta, Ulta Beauty, Humana: Top analyst calls today
- META Stock Surges on Major AI Publisher Partnerships
- Meta acquires AI-wearables startup Limitless
5. MSFT
Price: $483.16 (+0.48%)
- Meet the Supercharged Growth Stock That Could Join Apple, Nvidia, Microsoft, and Alphabet in the $2 Trillion Club by 2028
- How Recent AI And Cloud Developments Are Rewriting The Microsoft Investment Story
- Microsoft 365 to include more AI tools – at a higher price
6. NVDA
Price: $182.41 (-0.53%)
- Nvidia CEO says AI trade is a 5-layer cake: How to play
- Trump tariffs live updates: US may exit USMCA next year; Trump meets Nvidia’s Huang to talk AI chip curbs
- Top Funds Get Googly-Eyed Over This Breakout AI Stock Not Named Nvidia Or Palantir
7. TSLA
Price: $455.00 (+0.10%)
- Tesla’s cheaper Model 3 & Y in Europe, Netflix–Warner Bros. backlash
- Tesla Slips As Musk Says You Can Text In FSD
- Tesla Strikes Back: New Model 3 Launch Heats Up EV Price War in Europe
Disclaimer: This market briefing is for informational and educational purposes only and should not be considered investment advice. The information presented is based on publicly available data and represents the author’s analysis as of December 05, 2025. Stock prices are volatile and past performance does not guarantee future results. Always conduct your own research and consult with a qualified financial advisor before making investment decisions. The author may or may not hold positions in the securities discussed.

Leave a comment