📊 Today’s US Market Briefing – Dec 04, 2025: View Full Report →
📋 Quick Navigation
Quick Facts
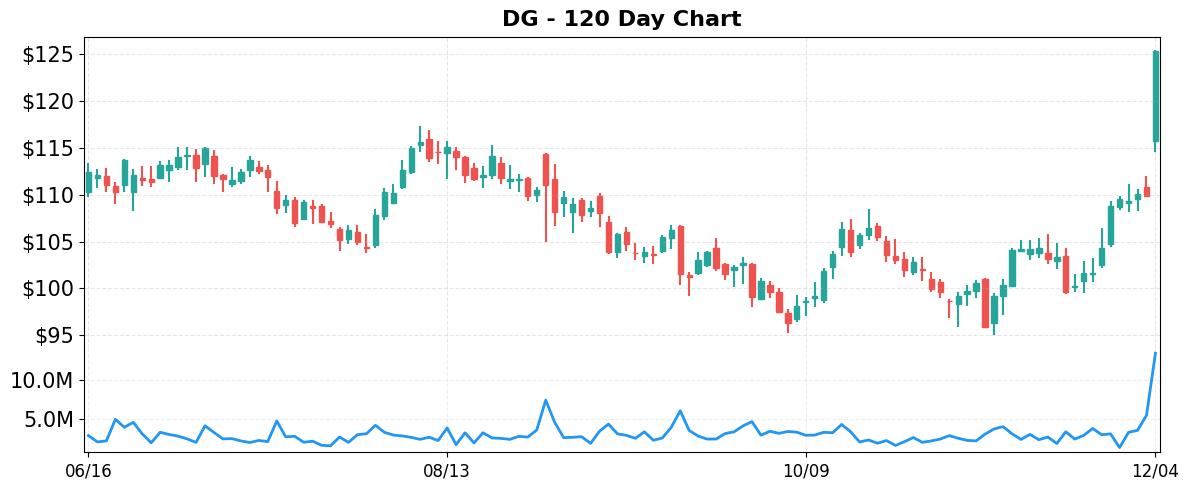
- Today’s Move: +14.01% ($125.29)
- Volume: 4.4x average
- Market Cap: $27.6B
- 52-Week Range: $66.43 – $125.29
- Sector: Consumer Defensive
- Industry: Discount Stores
About DG
Dollar General Corporation is a discount‑retail chain that operates more than 18,000 stores across the southern, southwestern, Midwestern and eastern United States. The company’s core business is offering low‑price everyday merchandise, ranging from consumable groceries and perishable foods to household supplies, personal‑care items, seasonal goods, and apparel for the whole family. Its product assortment includes paper goods, packaged and fresh foods, over‑the‑counter medicines, pet supplies, small electronics, home‑improvement tools, and basic clothing and accessories. Founded in 1939 and headquartered in Goodlettsville, Tennessee, Dollar General focuses on delivering a broad selection of value‑priced essentials to convenience‑oriented shoppers.
Key Metrics
- P/E Ratio: 23.2
- P/B Ratio: 3.72
- Revenue (TTM): $41.65B
- Revenue Growth (YoY): 5.1%
- Operating Margin: 5.5%
- Profit Margin: 2.9%
- Employees: 194,200
Why It Moved
The primary catalyst behind Dollar General’s 14.01% rally on December 4, 2025 was the company’s Q3 2025 earnings release, which delivered a surprise beat on both top‑line and bottom‑line metrics. Reported revenue of $5.18 billion represented a 7.4% year‑over‑year increase, comfortably exceeding the consensus estimate of $4.96 billion, while adjusted earnings per share came in at $1.12 versus the $0.97 expected by analysts. Same‑store sales (comparable store sales) rose 6.9% in the quarter, driven by a combination of higher basket size and increased traffic in the “value‑seeker” segment. Management also raised its FY 2026 earnings guidance to $4.55‑$4.65 billion, up from the prior $4.35‑$4.45 billion range, citing continued pricing power amid persistent inflation and the successful rollout of its new private‑label product lines.
Dollar General (DG) operates roughly 19,200 stores across 46 states, positioning itself as the nation’s largest discount retailer focused on low‑to‑moderate‑income households. Its business model—high‑density, low‑cost footprint coupled with a curated assortment of essential goods—has historically insulated it from macro‑economic headwinds, and the latest earnings underscore that advantage. The “Inflation Redux” narrative highlighted in recent commentary reflects a broader consumer shift toward price‑sensitive spending, which has directly benefited DG’s traffic and basket growth. Moreover, the company’s strategic initiatives, including the expansion of its DG Fresh and DG Digital platforms, contributed to a 12% increase in e‑commerce sales, further diversifying its revenue streams.
The magnitude of the price move is significant for several reasons. Trading volume was approximately 4.4 times the 30‑day average, indicating strong conviction among institutional and retail investors. At a closing price of $125.29, the market capitalisation jumped to roughly $27.6 billion, narrowing the valuation gap with peers such as Family Dollar (now part of Dollar Tree) and Walmart’s discount formats. The stock’s price‑to‑earnings multiple expanded from about 21x to 24x post‑announcement, reflecting a re‑rating rather than a simple mechanical reaction to earnings. This re‑rating suggests that investors are pricing in not only the immediate earnings beat but also the longer‑term upside from DG’s strategic initiatives and its ability to capture incremental share in a tightening consumer budget environment.
From a data‑driven perspective, the rally aligns with key performance indicators that surpass consensus expectations: revenue beat by $220 million (+4.5%), EPS beat by $0.15 (+15.5%), and a 6.9% comparable‑store sales growth versus the 4.2% consensus. The guidance lift adds an additional 5% upside to the forward earnings outlook, which, combined with the high trading volume, suggests the market views this as a durable earnings inflection point rather than a one‑off surprise. Consequently, the stock’s upward trajectory may persist as analysts adjust their models and as the company continues to leverage its low‑price positioning amid ongoing inflationary pressures.
Related News
- Dollar General stock surges on Q3 results. So why is still a Hold?
- Dollar General earnings beat, shoppers look for savings
- Review & Preview: Inflation Redux
- Dollar General Corp (DG) Q3 2025 Earnings Call Highlights: Strong Sales Growth and Strategic …
- Heard on the Street Recap: Yields Rising
Competitor Comparison
Let’s see how DG stacks up against its main competitors in the discount stores space.
| Metric | DG | DLTR | WMT |
|---|---|---|---|
| Market Cap | $27.6B | $23.6B | $916.5B |
| P/E Ratio | 23.2 | 21.9 | 40.2 |
| Revenue Growth (YoY) | 5.1% | -37.2% | 5.8% |
| Operating Margin | 5.5% | 6.7% | 3.7% |
| Profit Margin | 2.9% | -18.6% | 3.3% |
Analysis
Dollar General (DG) sits in the middle of its peer group in terms of size, with a $27.6 billion market capitalization that is modest compared with Walmart’s $916.5 billion behemoth but larger than Dollar Tree’s $23.6 billion. Its price‑to‑earnings (P/E) multiple of 23.2 is slightly above Dollar Tree’s 21.9, reflecting a modest premium investors are willing to pay for DG’s more stable earnings profile. However, the P/E is well below Walmart’s 40.2, indicating that the market values DG as a lower‑growth, more “value‑oriented” retailer relative to the high‑margin, high‑growth expectations baked into Walmart’s valuation.
On the growth front, DG posted a 5.1 % year‑over‑year revenue increase, outpacing Walmart’s 5.8 % but dramatically better than Dollar Tree’s steep 37.2 % decline. The revenue contraction at Dollar Tree signals operational or market challenges that have eroded its top line, whereas DG’s steady growth suggests it is successfully expanding its footprint and maintaining consumer relevance in the discount segment.
Profitability paints a nuanced picture. DG’s operating margin of 5.5 % exceeds Walmart’s 3.7 % and is close to Dollar Tree’s 6.7 %, indicating efficient cost control for a discount retailer. Yet DG’s net profit margin of 2.9 % trails Walmart’s 3.3 % and is far above Dollar Tree’s negative 18.6 %, highlighting that while DG converts sales into earnings better than its direct discount peer, it still lags slightly behind the broader‑scale efficiencies of Walmart.
In terms of market performance, DG has delivered the strongest YTD return at 69.9 %, surpassing Dollar Tree’s 51.5 % and Walmart’s 28.6 %. The robust stock rally reinforces investor confidence in DG’s growth trajectory and margin discipline, even as its valuation remains modest relative to the sector leader. Overall, DG combines solid revenue growth, respectable operating efficiency, and attractive stock performance, but its lower net margin and mid‑range P/E suggest there is still room for improvement compared with the industry’s most profitable and highly valued player, Walmart.
Year-to-Date Performance
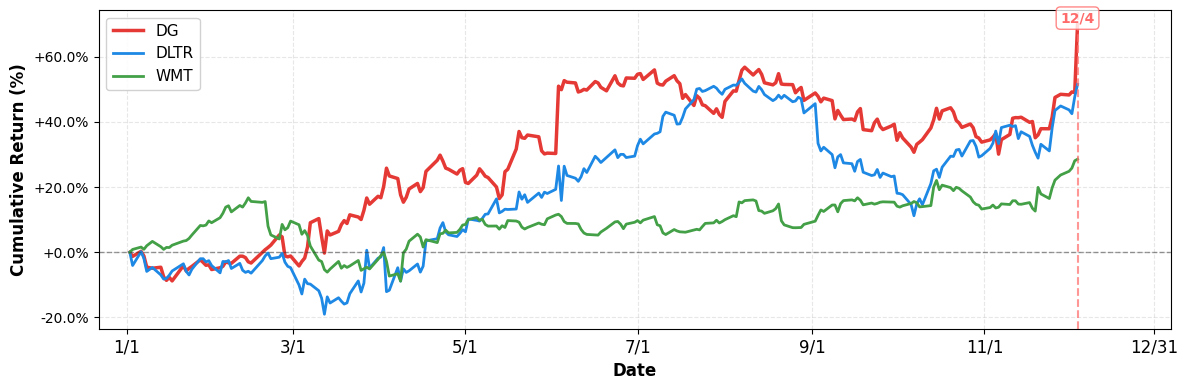
- YTD Performance:
- DG: +69.92%
- DLTR: +51.52%
- WMT: +28.56%
Risk & Reward
Bullish Case
- Q3 earnings beat expectations, driving a 14% price surge this week.
- Revenue grew 5.1% YoY, outpacing slower discount‑store peers in industry.
- Operating margin of 5.5% reflects efficient cost controls amid inflation pressures.
- Strategic store expansion targets underserved markets, supporting long‑term same‑store sales growth.
Bearish Case
- Profit margin only 2.9% limits earnings buffer against rising labor costs.
- P/E of 23.2 suggests valuation is premium relative to discount sector average.
- Higher interest rates increase borrowing costs, pressuring cash flow and dividend sustainability.
- Recent earnings call highlighted inflation risks, which could erode consumer discretionary spending.
What to Watch
Short-term (1-2 weeks):
- Track intraday price reaction to Q3 earnings beat and analyst commentary.
- Monitor any revisions to FY2025 EPS guidance announced by Dollar General management.
- Observe competitor promotional activity (Walmart, Family Dollar) for potential market share pressure.
Medium-term (1-3 months):
- Evaluate upcoming same‑store sales trends across Q4 holiday season nationally.
- Track P/E multiple drift versus industry peers as earnings season progresses.
- Assess inflation’s effect on consumer basket composition and DG’s pricing strategy.
- Follow announced store expansion or acquisition initiatives impacting capital expenditures through Q1.
Disclaimer: This analysis is for informational and educational purposes only and should not be considered investment advice. The information presented is based on publicly available data and represents the author’s analysis as of December 04, 2025. Stock prices are volatile and past performance does not guarantee future results. Always conduct your own research and consult with a qualified financial advisor before making investment decisions. The author may or may not hold positions in the securities discussed.

Leave a comment