🔥 Today’s Top Gainer Analysis (DG): View Full Analysis →
📋 Table of Contents
Market Overview
U.S. equities posted modest gains on December 04, 2025, as investors balanced mixed earnings reports with a steadier outlook on monetary policy. The broad market was driven by technology strength, while industrials faced slight pressure.
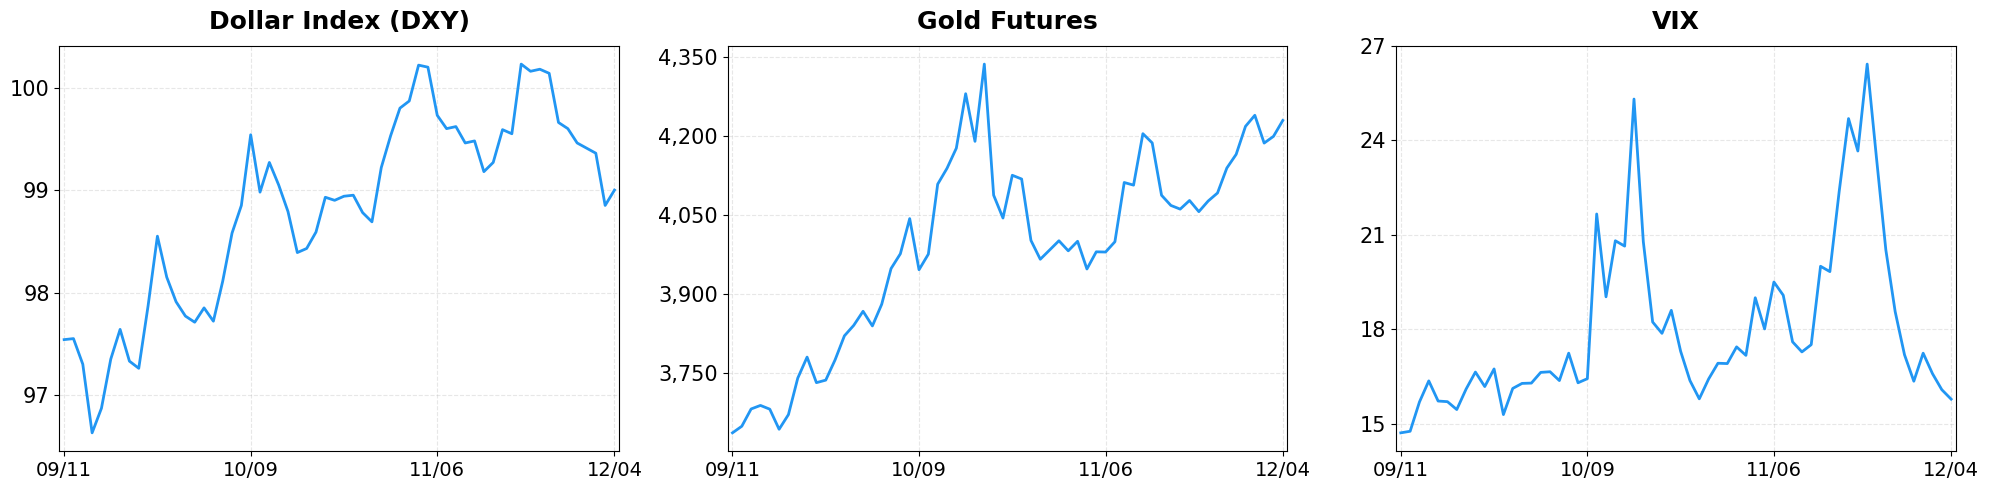
- Dollar Index moved from 98.85 to 99.00 (+0.15%).
- Gold Futures moved from 4199.30 to 4229.60 (+0.72%).
- VIX moved from 16.08 to 15.78 (-1.87%).
Today’s sector performance shows the following movements:

Market News Highlights
On December 04, 2025, U.S. equity futures opened largely unchanged as traders positioned themselves ahead of the Federal Reserve’s inflation report. The Dow, S&P 500, and Nasdaq futures all traded flat, reflecting a market that remains cautious but not overly bearish. The prevailing narrative is a growing conviction among Wall Street participants that the Fed may be preparing for another rate cut, a sentiment reinforced by the modest advance in the S&P 500 as investors await the upcoming data release. This “wait‑and‑see” stance kept volatility muted, with investors preferring to sit on the sidelines until the inflation numbers provide clearer guidance on monetary policy direction.
Technology headlines added another layer of nuance. Former Intel CEO’s praise of Google’s Gemini 3 highlighted a potential resurgence for the search‑engine giant, fueling optimism in the broader tech sector. Meanwhile, small‑cap stocks showed a notable surge, with Eli Lilly drawing particular attention as it tested key support levels. The combination of a tentative Fed outlook and sector‑specific catalysts resulted in a modest gain for the S&P 500, while the Nasdaq’s performance remained largely unchanged, underscoring the market’s selective enthusiasm for growth‑oriented stories amid an overall cautious environment.
Referenced Articles
- Stock market today: Dow, S&P 500, Nasdaq futures trade flat as Fed-favored inflation data looms
- Stock market today: Dow, S&P 500, Nasdaq end little changed as Wall Street’s Fed rate cut conviction runs high
- Former Intel CEO: Google is ‘roaring back’ with Gemini 3
- Dow Jones Futures: Small Caps Surge, Eli Lilly Tested; 5 Stocks In Buy Zones
- S&P 500 ekes out slight gain as investors await Fed decision
Index Performance
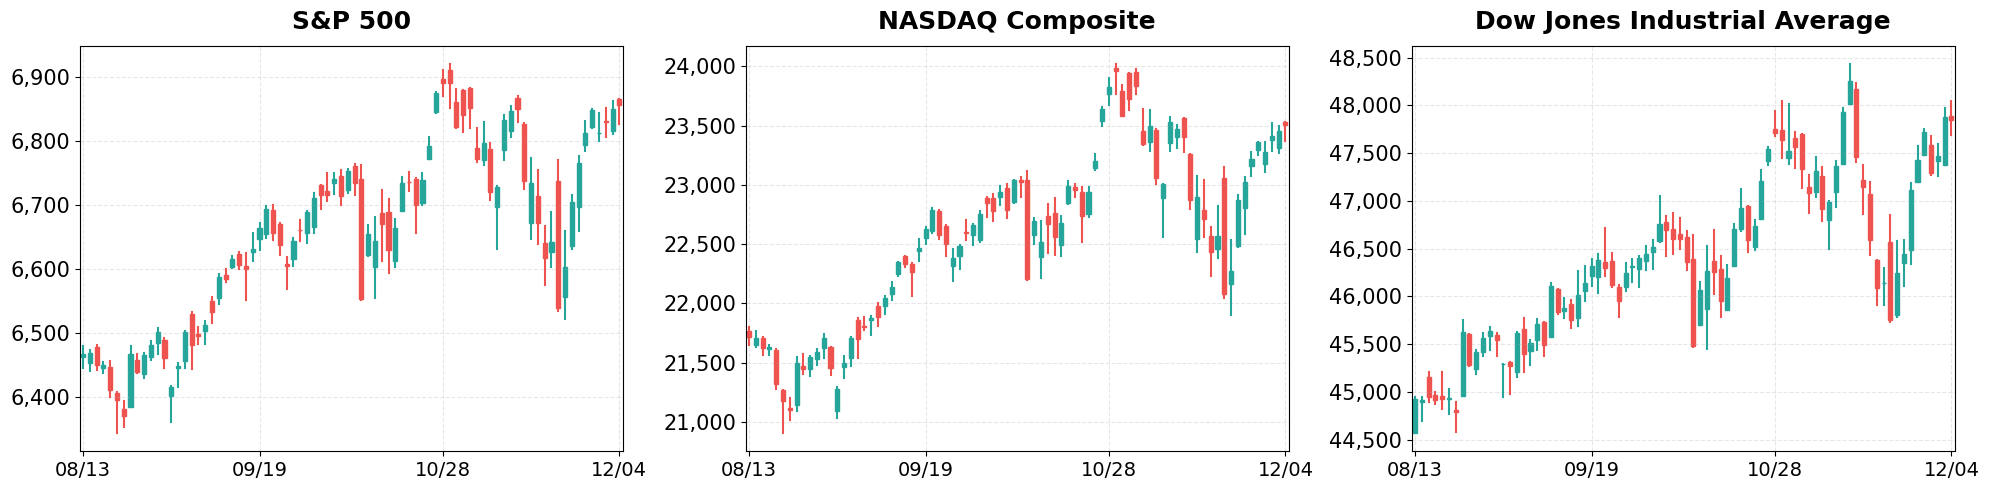
S&P 500 (+0.11%)
The S&P 500 closed at 6,857.12, up 7.40 points, reflecting a modest rally led by consumer‑discretionary and health‑care stocks that offset weaker energy prices.
NASDAQ Composite (+0.22%)
The NASDAQ Composite rose to 23,505.14, gaining 51.05 points, as leading chipmakers reported better‑than‑expected revenue, bolstering the technology sector’s momentum.
Dow Jones Industrial Average (-0.07%)
The Dow slipped to 47,850.94, down 31.96 points, pressured by declines in heavy‑industry and financial stocks amid concerns over upcoming earnings guidance.
Top Movers
Top Gainers

- DG (+14.01%)
- SNDK (+9.74%)
- GEV (+4.51%)
Top Losers

- INTC (-7.45%)
- LYB (-6.24%)
- ALB (-5.81%)
Magnificent 7
Overview

Performance Comparison: Magnificent 7 vs Major Indices
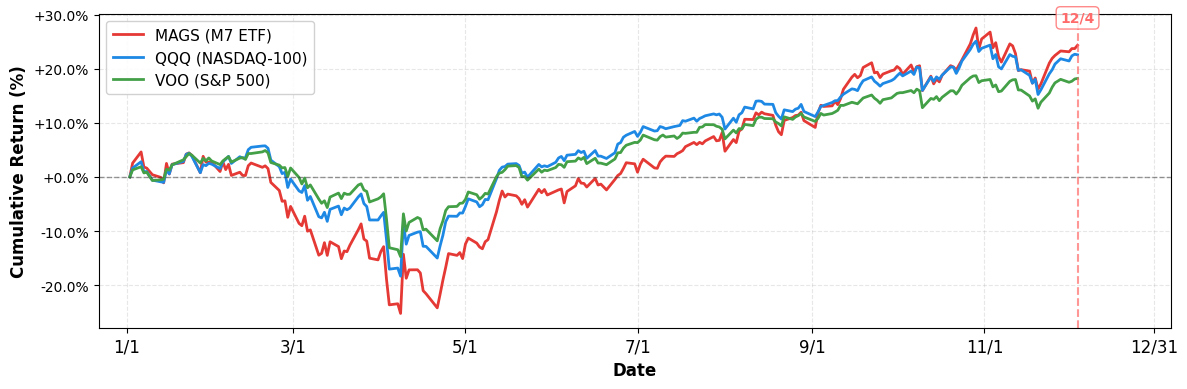
- YTD Performance:
- S&P 500 (VOO): +18.19%
- NASDAQ-100 (QQQ): +22.55%
- Magnificent 7 (MAGS): +24.32%
M7 Total Market Capitalization

- YTD Market Cap Change:
- $16.05T (1/1) → $19.43T (current), +21.06%
1. AAPL
Price: $280.70 (-1.21%)
- BTIG thinks Apple stock is poised to drop, PepsiCo nears settlement
- Apple’s executive shake-up continues with departures of general counsel and policy head
- Meta stock climbs on report company will make major cuts to metaverse efforts
2. AMZN
Price: $229.11 (-1.41%)
- Amazon-USPS Breakup Rumors Intensify Ahead of 2026 Contract Expiration
- Amazon Reviews Options as USPS Weighs Competitive Auction for Contract
- Why AI infrastructure is ‘unprecedented’ compared to cloud buildout
3. GOOGL
Price: $317.62 (-0.63%)
- Amazon vs. Alphabet vs. Meta: This analyst’s top AI pick
- Former Intel CEO: Google is ‘roaring back’ with Gemini 3
- TeraWulf (WULF): Reassessing Valuation After $7.7B AI Contracts, Google Backing and Strategic Pivot From Bitcoin Mining
4. META
Price: $661.53 (+3.43%)
- Meta stock climbs on report company will make major cuts to metaverse efforts
- Meta stock jumping as Bloomberg reports Metaverse budget cuts
- Stock market today: Dow, S&P 500, Nasdaq futures trade flat as Fed-favored inflation data looms
5. MSFT
Price: $480.84 (+0.65%)
- LG Elec says Microsoft and LG affiliates pursuing cooperation on data centres
- Could Microsoft Be a Multimillionaire-Maker Stock?
- Nebius Group (NasdaqGS:NBIS): Valuation Check After Major Microsoft and Meta AI Contracts Fill Data Center Capacity
6. NVDA
Price: $183.38 (+2.11%)
- Why Nvidia CEO went on Joe Rogan’s podcast & the White House
- Nvidia’s Jensen Huang discussed chip controls with Trump: Takeaways
- 2 underappreciated AI chip stocks that can compete with Nvidia
7. TSLA
Price: $454.53 (+1.74%)
- Tesla in top 10 brands, hybrid reliability improves: New report
- Elon Musk Says His ‘Running Robot’ Will ‘Actually Eliminate Poverty’ As He Shares Video Of Tesla Optimus Jogging
- Trump Is Doubling Down on Robotics. Does That Make Tesla Stock a Buy Here?
Disclaimer: This market briefing is for informational and educational purposes only and should not be considered investment advice. The information presented is based on publicly available data and represents the author’s analysis as of December 04, 2025. Stock prices are volatile and past performance does not guarantee future results. Always conduct your own research and consult with a qualified financial advisor before making investment decisions. The author may or may not hold positions in the securities discussed.

Leave a comment