[Watch today’s 60-second video summary here: (Feature coming soon)]
📋 Table of Contents
Market Overview
On December 02, 2025 (Tuesday), U.S. equities posted modest gains across the board, driven by optimism in earnings outlook and a steadier bond market. Broad‑based buying lifted the major averages, with the S&P 500, Nasdaq, and Dow all ending in positive territory. The U.S. Treasury 10‑year yield slipped to 4.12%, providing additional support to equity valuations.
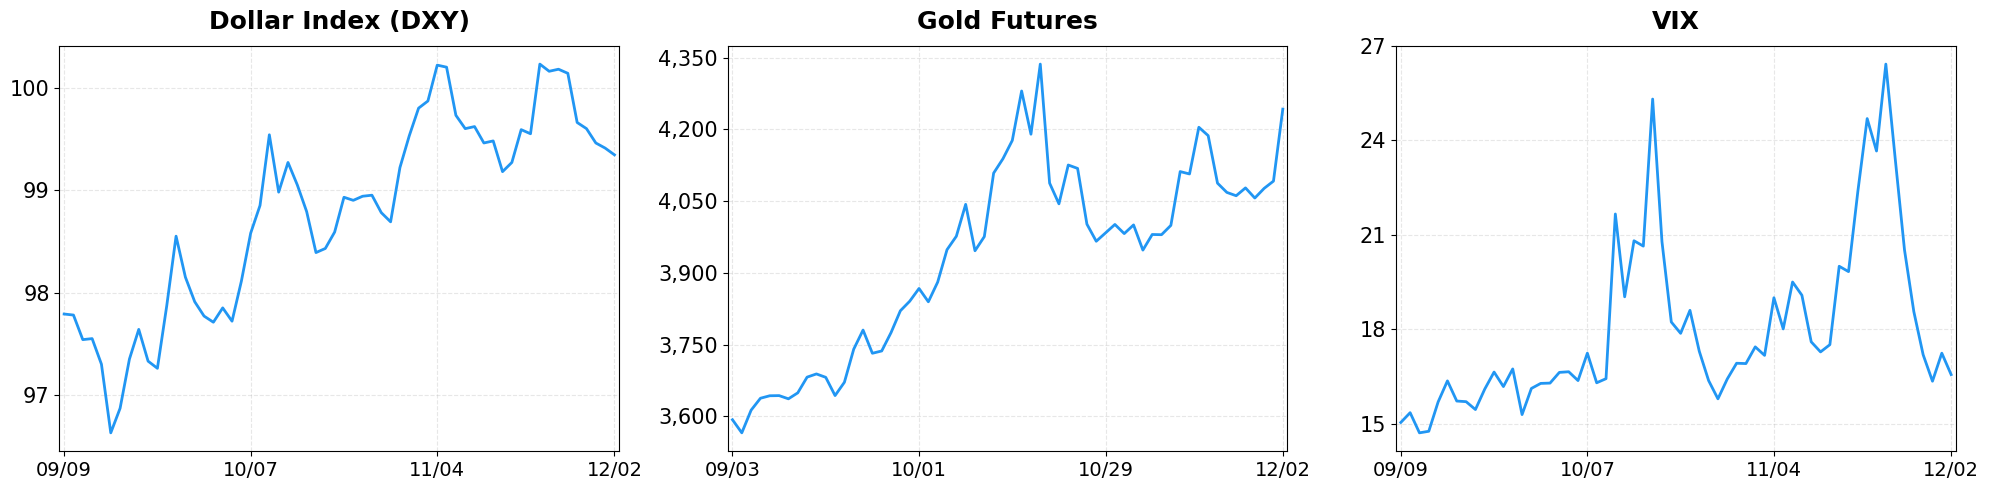
- Dollar Index moved from 99.41 to 99.34 (-0.07%).
- VIX moved from 17.24 to 16.55 (-4.00%).
Today’s sector performance shows the following movements:

Market News Highlights
On December 02, 2025, U.S. equity indexes posted broad gains, led by strength in technology and communication services sectors. The Dow Jones Industrial Average, S&P 500, and Nasdaq Composite all advanced, reflecting investor optimism after Bitcoin surged past the $90,000 level and continued upward momentum into the $91,000 range. The rally in crypto helped lift risk‑appetite, supporting high‑growth stocks while also providing a tailwind for broader market breadth.
Earnings season added further fuel to the upward trend. MongoDB and Credo both reported results that exceeded expectations, with AI‑driven product expansions driving double‑digit earnings beats. Their strong performance underscored the continued demand for AI infrastructure and cloud‑based solutions, prompting investors to rotate into growth‑oriented names despite lingering debates about the relative appeal of value versus growth stocks. Analysts noted that while the “tug‑of‑war” between these styles may intensify next year, the current earnings beat suggests growth narratives remain compelling in the near term.
The combined effect of a bullish crypto market, robust tech earnings, and sector‑specific strength helped lift overall market sentiment. However, the underlying tension between growth and value allocations could re‑emerge as macro‑economic data evolves, potentially moderating the rally. For now, the confluence of these drivers positions the market on a positive trajectory, with investors likely to monitor both cryptocurrency price action and upcoming earnings releases for further direction.
Referenced Articles
- Stock market today: Dow, S&P 500, Nasdaq rise as bitcoin rockets back above $90,000
- Earnings live: MongoDB, Credo stocks soar by double digits as AI build-out drives strong results
- More ‘tug-of-war’ between growth and value stocks expected next year
- Top Cryptocurrencies Rise; Bitcoin Tops $91,000
- Technology, Communication Services Help Push US Equity Indexes Higher
Index Performance
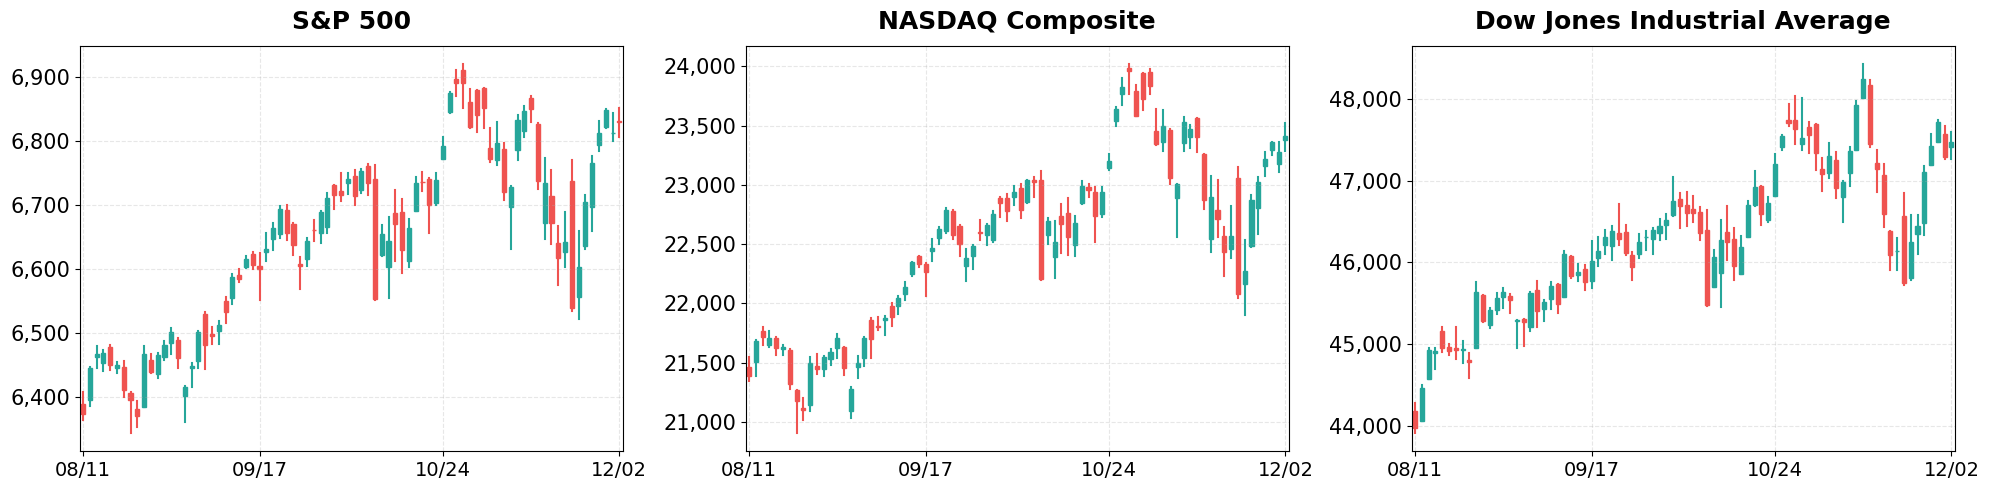
S&P 500 (+0.25%)
The S&P 500 closed at 6,829.37, up 16.74 points, as defensive sectors such as utilities and consumer staples led the rally, offsetting modest weakness in technology stocks. The modest gain suggests investors are rotating into quality names while awaiting the next wave of earnings guidance.
NASDAQ Composite (+0.59%)
The Nasdaq outperformed, finishing at 23,413.67 with a gain of 137.75 points, propelled by stronger-than‑expected earnings from several mid‑cap growth companies and renewed demand for cloud services. Momentum in the semiconductor segment also helped sustain the broader tech‑heavy index’s upward trajectory.
Dow Jones Industrial Average (+0.39%)
The Dow rose to 47,474.46, adding 185.13 points, as industrials and financials benefited from improving profit forecasts and a flattening yield curve that supports capital‑intensive businesses. The performance underscores the market’s confidence in a stable macro environment despite lingering inflation concerns.
Looking ahead, analysts will monitor upcoming corporate earnings and the Federal Reserve’s policy stance for clues on whether the current upward bias can be sustained.
Top Movers
Top Gainers

- BA (+10.16%)
- INTC (+8.65%)
- NXPI (+7.95%)
Top Losers

- XYZ (-6.59%)
- PKG (-5.26%)
- IP (-3.44%)
Magnificent 7
Overview

Performance Comparison: Magnificent 7 vs Major Indices

- YTD Performance:
- S&P 500 (VOO): +17.69%
- NASDAQ-100 (QQQ): +22.37%
- Magnificent 7 (MAGS): +23.75%
M7 Total Market Capitalization

- YTD Market Cap Change:
- $16.05T (1/1) → $19.46T (current), +21.25%
1. AAPL
Price: $286.19 (+1.09%)
- Apple AI chief exits, MongoDB stock soars by 25% on Q3 earnings
- Apple’s quiet AI era just got a very loud replacement
- Apple’s Hiring of Amar Subramanya Likely to Help Improve AI Strategy, Wedbush Says
2. AMZN
Price: $234.42 (+0.23%)
- American Bitcoin stock plunges, Amazon’s ultra-fast deliveries
- Amazon releases new AI chip amid industry push to challenge Nvidia’s dominance
- Amazon’s AI Chip Strike: Can Trainium3 Finally Crack Nvidia’s Grip?
3. GOOGL
Price: $315.81 (+0.29%)
- Why Nvidia, Google, and Uber still control the market
- Beta inks $1B deal with Eve Air Mobility, Estée Lauder’s AI chatbot
- Are energy constraints the only risk to AI momentum?
4. META
Price: $647.10 (+0.97%)
- 1 Compelling Reason to Buy Meta Hand Over Fist Right Now
- Amazon AWS VP: AI agents will be biggest technology change ‘since the beginning of cloud computing’
- Microreactor startup Antares raises $96M for land, sea, and space-based nuclear power
5. MSFT
Price: $490.00 (+0.67%)
- Microsoft Rebounds But Watch This Key Level; Is The Stock A Buy Now?
- Update: TikTok and Microsoft’s LinkedIn Under Investigation by Irish Media Regulator
- TikTok and Microsoft’s LinkedIn Under Investigation by Irish Media Regulator
6. NVDA
Price: $181.46 (+0.86%)
- Intel stock climbs more than 7% on report it will supply chips for Apple
- OpenAI CEO Sam Altman declares ‘code red’ as ChatGPT competition mounts
- Michael Burry says Tesla is ‘ridiculously overvalued,’ slams Musk pay package
7. TSLA
Price: $429.24 (-0.21%)
- Michael Burry says Tesla is ‘ridiculously overvalued,’ slams Musk pay package
- Tesla valuation, Elon Musk’s $1T pay called out by Michael Burry
- Price Prediction: Can Tesla Really Be Worth $8.5 Trillion in 10 Years or Less?
Disclaimer: This market briefing is for informational and educational purposes only and should not be considered investment advice. The information presented is based on publicly available data and represents the author’s analysis as of December 02, 2025. Stock prices are volatile and past performance does not guarantee future results. Always conduct your own research and consult with a qualified financial advisor before making investment decisions. The author may or may not hold positions in the securities discussed.

Leave a comment