📋 Quick Navigation
Quick Facts
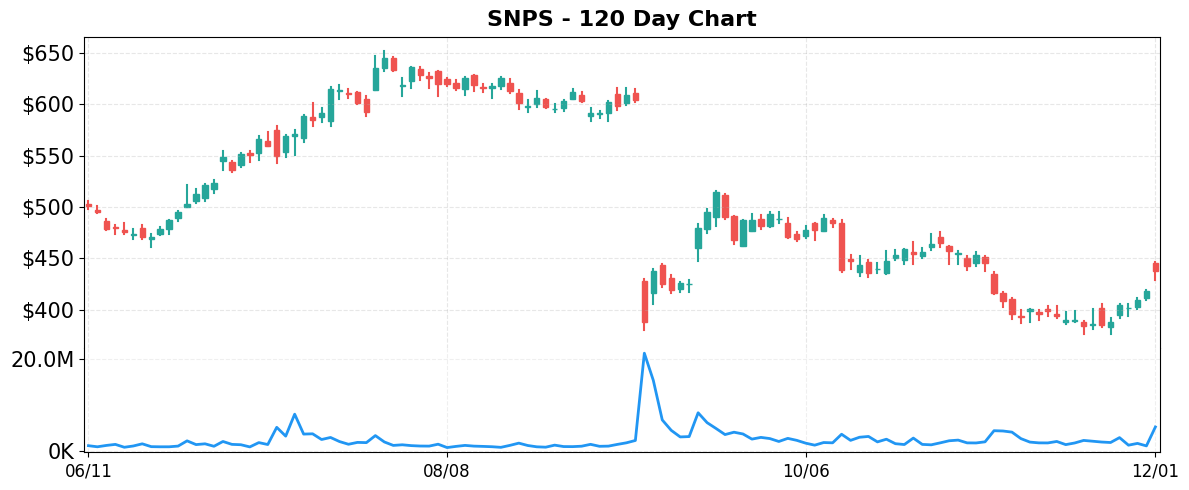
- Today’s Move: +4.85% ($438.29)
- Volume: 1.7x average
- Market Cap: $81.4B
- 52-Week Range: $365.74 – $651.73
- Sector: Technology
- Industry: Software – Infrastructure
About SNPS
Synopsys, Inc. is a leading provider of electronic design automation (EDA) software that enables the design, verification, and testing of integrated circuits and system‑on‑chips. It operates in two primary segments—Design Automation, which offers digital and custom IC design tools, verification platforms (including simulation, emulation, FPGA prototyping, and AI‑driven solutions), and TCAD/manufacturing analytics—and Design IP, which supplies a broad portfolio of reusable intellectual property such as interface standards (UCIe, USB, PCIe, DDR, Ethernet, MIPI, HDMI), processor cores, security blocks, automotive‑grade IP, and SoC infrastructure components. Together, these solutions help semiconductor companies accelerate chip development, improve performance, and reduce time‑to‑market. The company was founded in 1986 and is headquartered in Sunnyvale, California.
Key Metrics
- P/E Ratio: 59.2
- P/B Ratio: 2.94
- Revenue (TTM): $6.44B
- Revenue Growth (YoY): 14.0%
- Operating Margin: 9.5%
- Profit Margin: 31.0%
- Employees: 20,000
Why It Moved
The dominant driver behind Synopsys, Inc.’s (SNPS) 4.85% rally to close at $438.29 on December 1, 2025 was Nvidia’s announcement of a $2 billion equity investment in the chip‑design firm. The transaction, disclosed in multiple outlets—including “Nvidia Invests $2 Billion in Synopsys to Broaden AI Design Partnership” and “Nvidia Just Took a $2 Billion Stake in Chip Design Company”—signals a deepening strategic alliance that extends beyond a typical vendor‑customer relationship. By taking a sizable stake, Nvidia not only secures preferential access to Synopsys’s electronic design automation (EDA) and IP portfolios but also positions itself to co‑develop AI‑driven design flows that could accelerate the rollout of next‑generation GPUs and data‑center chips. The market’s immediate reaction—volume trading at 1.7 times the average—reflects investors’ view of the investment as a material, near‑term catalyst for revenue growth and margin expansion.
Synopsys is the world’s largest provider of EDA software and semiconductor IP, serving the majority of the global fabless and integrated device manufacturers. Its product suite, which now includes AI‑enhanced verification and layout tools, is a critical component of the semiconductor design value chain. The company’s market capitalisation of $81.4 billion places it among the top-tier technology firms, and its historical earnings growth has been anchored by recurring licensing revenues and high‑margin IP sales. The Nvidia partnership dovetails with Synopsys’s strategic push to embed AI throughout the design process, an initiative highlighted in the “AI: Late 2026 will be inflection point for these hyperscalers” headline, suggesting that the collaboration could accelerate adoption of AI‑centric design methodologies ahead of the anticipated industry inflection point.
The price movement is significant for several reasons. First, the premium paid by Nvidia implies a valuation uplift for Synopsys, potentially translating into higher forward price‑to‑earnings multiples as analysts revise earnings forecasts to incorporate the incremental revenue from joint AI‑design projects. Second, the partnership may create a barrier to entry for competitors, reinforcing Synopsys’s market dominance and providing a defensible moat in an increasingly AI‑focused semiconductor ecosystem. Finally, the rally occurred while the broader tech sector posted mixed performance, indicating that the Nvidia stake is a company‑specific catalyst strong enough to overcome sector‑wide headwinds. If the collaboration delivers on its promise, Synopsys could see a multi‑digit percentage boost to its top line over the next 12‑18 months, justifying the current price appreciation and setting the stage for continued outperformance relative to peers.
Related News
- AI: Late 2026 will be inflection point for these hyperscalers
- Nvidia & Synopsys, Strategy’s new reserve, Accenture & OpenAI
- Sector Update: Tech Stocks Mixed Late Afternoon
- Nvidia Invests $2 Billion in Synopsys to Broaden AI Design Partnership
- Nvidia Just Took a $2 Billion Stake in Chip Design Company
Competitor Comparison
Let’s see how SNPS stacks up against its main competitors in the software – infrastructure space.
| Metric | SNPS | CDNS | ANSS |
|---|---|---|---|
| Market Cap | $81.4B | $84.4B | N/A |
| P/E Ratio | 59.2 | 80.0 | N/A |
| Revenue Growth (YoY) | 14.0% | 10.1% | N/A |
| Operating Margin | 9.5% | 35.1% | N/A |
| Profit Margin | 31.0% | 20.4% | N/A |
Analysis
Synopsys (SNPS) sits in the middle of its peer group in terms of market capitalization, trailing the Cadence Design Systems (CDNS) by about $3 billion. The most striking divergence is in valuation: SNPS trades at a forward‑looking P/E of roughly 59x, whereas CDNS commands a premium of 80x. This gap suggests that investors are pricing in higher growth expectations or a perceived quality advantage for Cadence, despite its larger valuation. The absence of comparable data for ANSS limits a full peer assessment, but the missing metrics also signal potential market opacity or a different business focus that may affect investor confidence.
Revenue growth is a clear strength for SNPS, outpacing Cadence with a 14.0% annual increase versus CDNS’s 10.1%. However, the higher growth has not translated into superior profitability. SNPS’s operating margin sits at a modest 9.5%, considerably below Cadence’s 35.1%, and its net profit margin of 31.0%—while respectable—still trails Cadence’s 20.4% margin after accounting for the operating margin discrepancy. The gap in operating efficiency indicates that Cadence extracts more earnings from each dollar of sales, likely due to a more scalable software‑centric model, whereas Synopsys may be bearing higher R&D or cost structures.
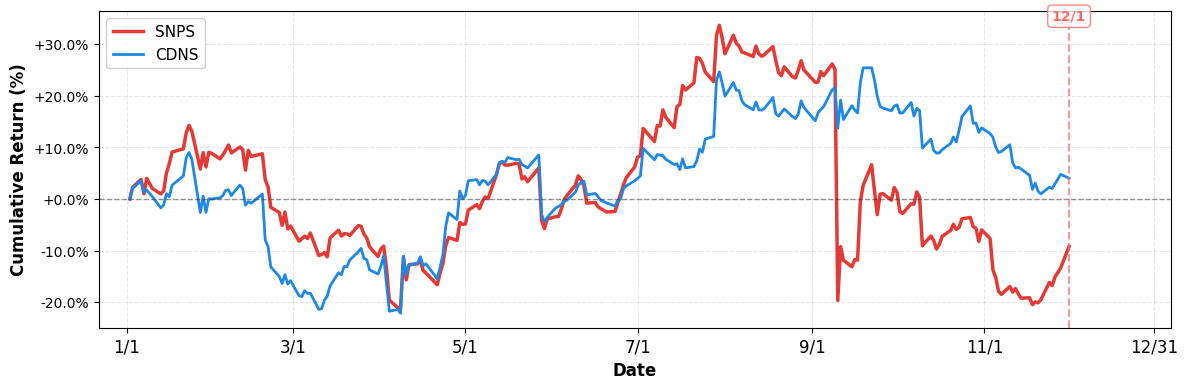
From a shareholder return perspective, the two companies have diverged sharply this year. SNPS has delivered a YTD return of –9.21%, reflecting market pressure on its higher‑priced earnings multiple and perhaps concerns about margin compression. In contrast, CDNS has posted a modest 4.02% gain, reinforcing the narrative that the market rewards its higher‑margin, albeit slower‑growing, business model. The divergent YTD performance underscores the importance of balancing growth expectations with profitability and valuation discipline.
Overall, Synopsys offers stronger top‑line growth but lags behind Cadence in operational efficiency and investor sentiment, as reflected in both valuation multiples and recent stock performance. The lack of data for ANSS prevents a comprehensive three‑way comparison, but the available metrics suggest that investors must weigh SNPS’s growth potential against its lower margins and higher relative valuation when assessing its competitive positioning.
Year-to-Date Performance
- YTD Performance:
- SNPS: -9.21%
- CDNS: +4.02%
Risk & Reward
Bullish Case
- Nvidia’s $2 billion stake validates Synopsys’ AI design platform, boosting growth prospects.
- Revenue growth of 14% aligns with expanding semiconductor design services demand.
- Operating margin nearing 10% indicates efficient cost structure amid high-margin software.
- Profit margin of 31% provides cushion for R&D investment in AI tools.
Bearish Case
- P/E ratio 59.2 suggests stock may be overvalued versus peers.
- AI inflection point in late 2026 could delay near‑term revenue realization.
- Dependence on hyperscaler partnerships exposes Synopsys to significant concentration risk.
- Market volatility may erode recent 4.85% gain, pressuring valuation further.
What to Watch
Short-term (1-2 weeks):
- Monitor Synopsys share price volatility following Nvidia’s $2 billion investment announcement.
- Watch for updated Q2 earnings guidance reflecting AI partnership revenue uplift.
- Check SEC filings for any joint venture or IP licensing agreements with Nvidia.
- Observe analyst commentary on hyperscaler AI inflection point impact on Synopsys pipeline.
Medium-term (1-3 months):
- Track Q3 earnings release for AI‑driven design tool revenue growth trends.
- Assess adoption rates of Synopsys’ AI‑enhanced verification platforms among chipmakers.
- Monitor Cadence’s competitive moves and pricing pressure in response to Nvidia partnership.
- Watch for regulatory or antitrust reviews of the Nvidia‑Synopsys strategic alliance.
Disclaimer: This analysis is for informational and educational purposes only and should not be considered investment advice. The information presented is based on publicly available data and represents the author’s analysis as of December 01, 2025. Stock prices are volatile and past performance does not guarantee future results. Always conduct your own research and consult with a qualified financial advisor before making investment decisions. The author may or may not hold positions in the securities discussed.

Leave a comment