[Watch today’s 60-second video summary here: (Feature coming soon)]
📋 Table of Contents
Market Overview

U.S. equity markets opened lower on December 01, 2025, as investors weighed fresh data on inflation and a mixed earnings backdrop. The broad sell‑off was led by the Dow Jones Industrial Average, which fell the most among the major indices, reflecting weakness in industrial and financial stocks. Broad‑based risk aversion kept the S&P 500 and Nasdaq Composite under pressure, leaving all three benchmarks in negative territory for the session.
- Dollar Index moved from 99.46 to 99.40 (-0.06%).
- VIX moved from 16.35 to 17.38 (+6.30%).
Today’s sector performance shows the following movements:

Market News Highlights
Equity indices opened lower on December 01, 2025, as the broader market reacted to a sharp pull‑back in Bitcoin, which slipped below the $86,000 threshold. The Dow Jones Industrial Average, S&P 500, and Nasdaq Composite all posted modest declines, reflecting investor caution that the cryptocurrency sell‑off could spill over into risk‑on assets. The move underscores the growing correlation between digital‑asset sentiment and traditional equity markets, especially as retail and institutional participants alike adjust exposure amid heightened volatility.
Despite the near‑term weakness, several Wall Street analysts remain optimistic about the longer‑term trajectory of U.S. equities. RBC announced a 12‑month S&P 500 target of 7,750, suggesting confidence that earnings momentum and fiscal policy support will eventually lift the index. Parallel forecasts from other firms project the S&P 500 could breach the 8,000 level by 2026, driven by continued corporate earnings growth and a resilient consumer base. These bullish outlooks are tempered by the current market dip, creating a potential buying opportunity for value‑oriented investors who are scouting “quality value names” ahead of the holiday shopping season.
The cryptocurrency sector’s downturn, highlighted by Bitcoin’s slide and broader crypto price declines, adds another layer of risk. While crypto‑related equities may feel pressure, the broader market may benefit from a reallocation of capital into more established sectors. Investors should monitor the interplay between crypto sentiment, equity valuations, and the upcoming holiday retail dynamics, as they collectively shape market direction in the weeks ahead.
Referenced Articles
- Stock market today: Dow, S&P 500, Nasdaq slide as bitcoin tumbles to kick off December
- RBC sets 12-month S&P 500 target at 7,750 as more Wall Street firms turn bullish on stocks
- Stock market holiday shopping: How to find quality value names
- Wall Street’s 2026 forecasts are rolling in — and some see the S&P 500 hitting 8,000
- Top Cryptocurrencies Fall; Bitcoin Drops Below $86,000 Level
Index Performance
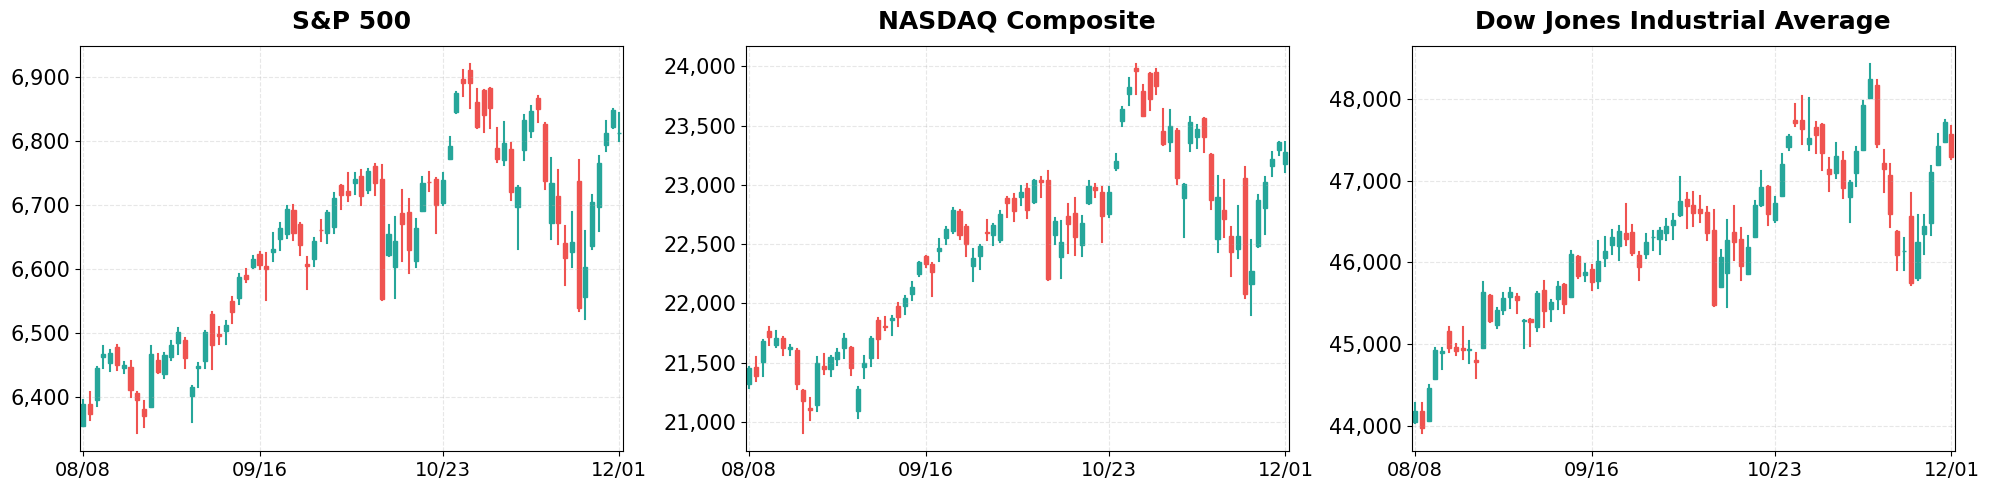
S&P 500 (-0.53%)
The S&P 500 slipped to 6,812.63, down 0.53% or 36.46 points, as technology and consumer discretionary names struggled to maintain momentum. Volume was moderate, and the decline was exacerbated by a rise in Treasury yields that pressured growth‑oriented stocks.
NASDAQ Composite (-0.38%)
The Nasdaq Composite eased to 23,275.92, a 0.38% drop (‑89.77 points), led by a pullback in mega‑cap tech shares after weaker-than‑expected guidance from a key semiconductor maker. Despite the dip, the index still posted a modest gain on the week, suggesting resilience amid broader market weakness.
Dow Jones Industrial Average (-0.90%)
The Dow Jones Industrial Average fell to 47,289.33, down 0.90% or 427.09 points, as heavyweight industrials and banks logged fresh losses on concerns over slowing global demand. The broader market sell‑off was amplified by a sharp rise in the 10‑year Treasury yield, which eroded the sector’s valuation multiples.
Top Movers
Top Gainers

- SNPS (+4.85%)
- DECK (+4.54%)
- APP (+4.02%)
Top Losers
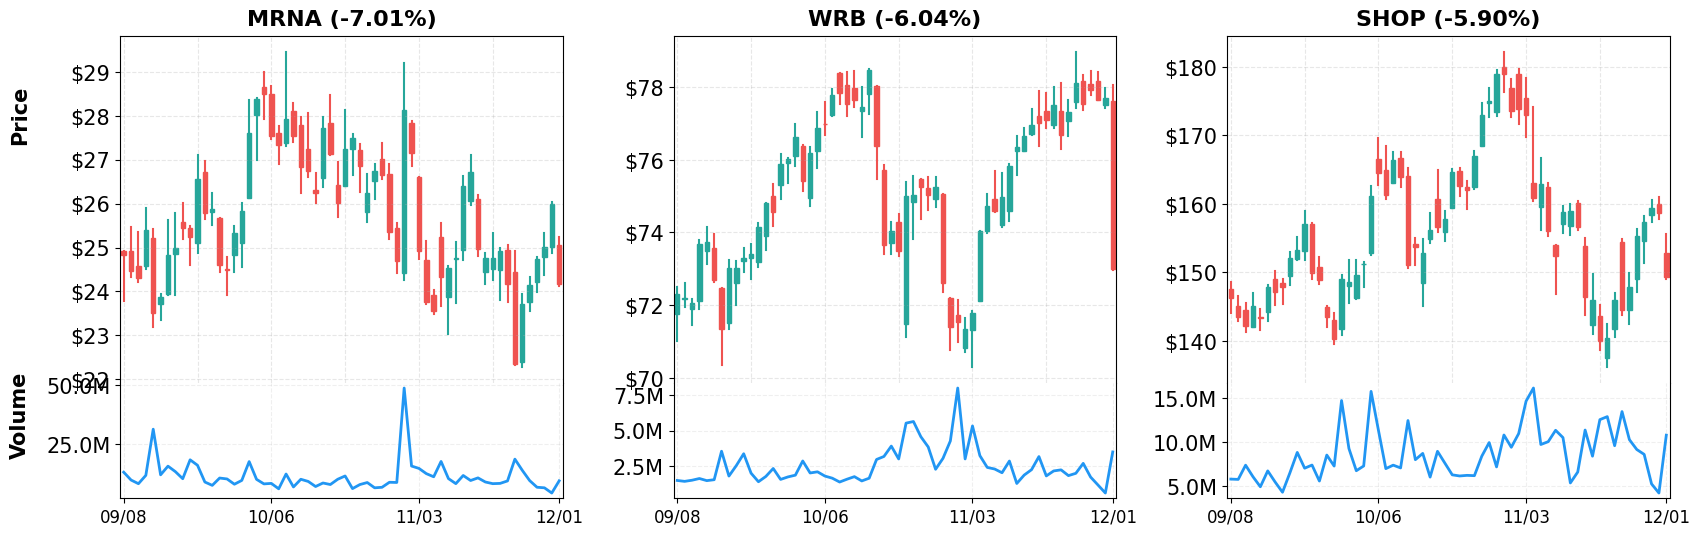
- MRNA (-7.01%)
- WRB (-6.04%)
- SHOP (-5.90%)
Magnificent 7
Overview

Performance Comparison: Magnificent 7 vs Major Indices

- YTD Performance:
- S&P 500 (VOO): +17.49%
- NASDAQ-100 (QQQ): +21.42%
- Magnificent 7 (MAGS): +23.12%
M7 Total Market Capitalization

- YTD Market Cap Change:
- $16.05T (1/1) → $19.33T (current), +20.44%
1. AAPL
Price: $283.10 (+1.52%)
- Intel Could Break Through Apple Barrier — Analysts Say This Could Redefine Foundry Competition
- Apple Stock Looks Cheap Here Based on Strong FCF – Shorting OTM Put Options Has Worked
- Is Apple Giving Intel’s Foundry Ambitions a Much-Needed Boost?
2. AMZN
Price: $233.88 (+0.28%)
- Analysts Remain Optimistic for Amazon.com (AMZN)
- AI: Late 2026 will be inflection point for these hyperscalers
- Cyber Monday: Consumers search for value in K-shaped economy
3. GOOGL
Price: $314.89 (-1.65%)
- Alphabet Poised for Revenue Boost as TPU Production Outlook Rises, Morgan Stanley Says
- Alphabet Stock Climbs 31% as Retail Traders Bet on TPU Price War With NVIDIA
- Stocks To Watch As Google Drives Rattled But Rebounding Market
4. META
Price: $640.87 (-1.09%)
- Meta Might Use Google TPUs in 2027. Should Nvidia Investors Panic?
- Today’s Market: Nasdaq Leads Market Retreat. Nvidia, Meta, Tesla Slide Amid Risk-Off Mood
- Stocks drift back toward record highs as the final month of 2025 gets underway: What to watch this week
5. MSFT
Price: $486.74 (-1.07%)
- Nebius Group (NBIS)’s Microsoft Deal Has Impressed Analysts
- ServiceNow (NOW) Grows Enterprise AI Heft With Microsoft Deal
- Microsoft Up 16.7% YTD: Will OpenAI Partnership Drive Stock Further?
6. NVDA
Price: $179.92 (+1.65%)
- Nvidia & Synopsys, Strategy’s new reserve, Accenture & OpenAI
- Nvidia Stock Is Rising — AI Partnership With HPE Expands in Europe
- Nvidia Invests $2 Billion in Synopsys to Broaden AI Design Partnership
7. TSLA
Price: $430.14 (-0.01%)
- Tesla (TSLA) Stock Dips as European Sales Plunge Over 50%
- Tesla Europe Sales Slide Despite Refresh
- Today’s Market: Nasdaq Leads Market Retreat. Nvidia, Meta, Tesla Slide Amid Risk-Off Mood
Disclaimer: This market briefing is for informational and educational purposes only and should not be considered investment advice. The information presented is based on publicly available data and represents the author’s analysis as of December 01, 2025. Stock prices are volatile and past performance does not guarantee future results. Always conduct your own research and consult with a qualified financial advisor before making investment decisions. The author may or may not hold positions in the securities discussed.

Leave a comment