📋 Quick Navigation
Quick Facts
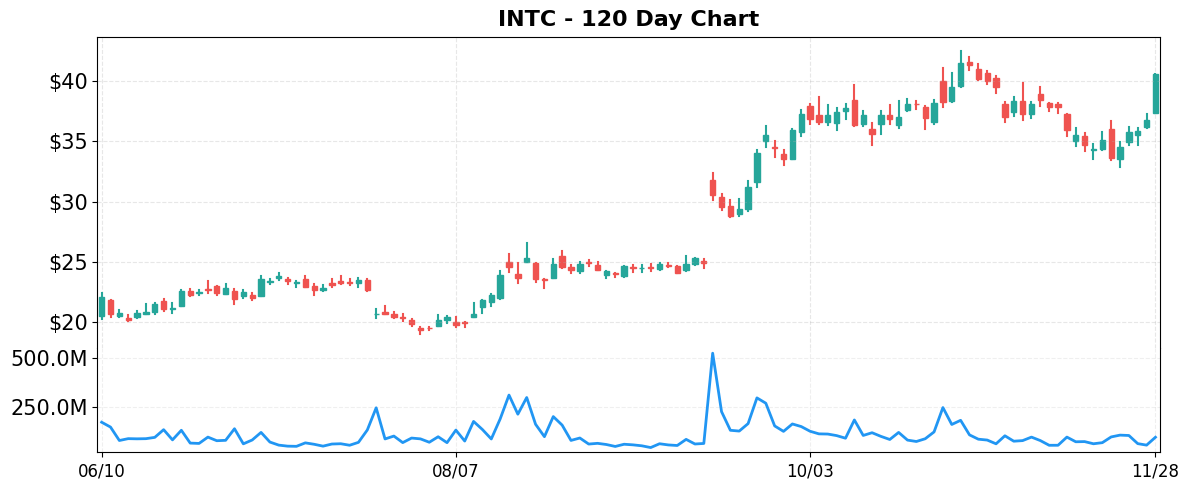
- Today’s Move: +10.19% ($40.56)
- Volume: 0.9x average
- Market Cap: $193.5B
- 52-Week Range: $17.67 – $42.48
- Sector: Technology
- Industry: Semiconductors
About INTC
Intel Corporation designs, manufactures, and markets a broad portfolio of computing hardware and related services, ranging from central processing units, graphics processors, accelerators, FPGAs, and system‑on‑chips to memory, storage, and networking components. Its business is organized around three segments—Intel Products, Intel Foundry Services, and other offerings—covering CPUs and chipsets, advanced packaging and silicon‑on‑foundry services, and AI‑optimized software and workload‑specific solutions such as autonomous‑driving platforms and intelligent edge platforms. Intel serves original equipment manufacturers, design partners, cloud providers, and other technology firms, delivering both silicon and software tools that enable digital transformation from data‑center to edge. Founded in 1968 and headquartered in Santa Clara, California, Intel remains a leading supplier of semiconductor technology worldwide.
Key Metrics
- P/E Ratio: 676.0
- P/B Ratio: 1.82
- Revenue (TTM): $53.44B
- Revenue Growth (YoY): 2.8%
- Operating Margin: 6.3%
- Profit Margin: 0.4%
- Employees: 88,400
Why It Moved
Intel Corporation (INTC) surged 10.19% to close at $40.56 on November 28, 2025, a move that was overwhelmingly driven by market‑wide speculation that the chipmaker has secured a “big new customer,” with multiple outlets explicitly linking the rally to unverified Apple‑deal rumors. The headline “Intel Soars Amid Apple Deal Rumors” appeared across major financial feeds, and the concurrent story about “Intel’s Stock Pops as Rumors Swirl About a Big New Customer” amplified investor expectations that Apple may finally diversify its silicon supply beyond its own in‑house designs. While a separate rumor about alleged technology theft from TSMC also circulated, the volume pattern—trading at only 0.9 × its average daily volume—indicates that the price spike was not supported by broad institutional buying but rather by a rapid, sentiment‑driven response to the Apple‑related chatter.
Intel remains the world’s largest PC‑focused semiconductor manufacturer, with a market capitalization of roughly $193.5 billion and a dominant position in data‑center CPUs, 7 nm and 10 nm process nodes, and emerging AI accelerators. Despite a challenging two‑year earnings cycle marked by delayed 7 nm yield improvements and competitive pressure from AMD and Nvidia, the company has been steadily rebuilding its balance sheet and expanding its foundry services. Consequently, any credible indication of a marquee client—especially a consumer‑electronics titan like Apple—would represent a material shift in Intel’s revenue mix, potentially unlocking higher-margin client‑specific contracts and reinforcing its strategic pivot toward a more diversified foundry business.
The magnitude of the move is significant for several reasons. First, a single‑digit percentage change is typical for a $193 B‑cap stock, but a 10% jump in one session signals a rapid re‑pricing of future cash‑flow expectations, especially given the modest volume. Second, the rally outpaced the broader market, with the Nasdaq posting its first monthly decline since April while Intel’s peers—AMD (+2.1%) and Nvidia (‑3.8%)—remained relatively flat, underscoring the stock‑specific nature of the catalyst. Third, the price appreciation translates to an incremental market‑value gain of about $20 billion, which could accelerate Intel’s ability to fund its IDM 2.0 roadmap, increase R&D spend, and improve its leverage ratios without additional equity dilution.
From a data‑driven perspective, the price action reflects a classic “rumor‑driven breakout” scenario: a high‑impact, unverified narrative triggered a sharp price move on low relative volume, suggesting limited conviction among long‑term holders. Investors should therefore monitor subsequent disclosures—particularly any official statements from Apple or Intel, SEC filings, and supply‑chain confirmations—to gauge whether the rally is sustainable or likely to reverse once the speculation dissipates. Until concrete contractual details emerge, the risk‑reward profile remains tilted toward short‑term opportunism rather than a fundamental shift in Intel’s long‑term valuation.
Related News
- Intel’s Stock Pops as Rumors Swirl About a Big New Customer
- Intel (INTC) Stock Jumps Amid Allegations of Stolen Tech from TSMC
- Stock Market Today: Dow Positive For November, But Nvidia Slides; Delayed Inflation Data Looms (Live Coverage)
- Equities Extend Winning Streak; Nasdaq Logs First Monthly Fall Since April
- S&P 500 Gains and Losses Today: Intel Soars Amid Apple Deal Rumors; Eli Lilly Stock Slides
Competitor Comparison
Let’s see how INTC stacks up against its main competitors in the semiconductors space.
| Metric | INTC | AMD | NVDA |
|---|---|---|---|
| Market Cap | $193.5B | $354.1B | $4302.0B |
| P/E Ratio | 676.0 | 113.9 | 43.8 |
| Revenue Growth (YoY) | 2.8% | 35.6% | 62.5% |
| Operating Margin | 6.3% | 13.7% | 63.2% |
| Profit Margin | 0.4% | 10.3% | 53.0% |
Analysis
Intel (INTC) remains the smallest of the three peers by market capitalization at $193.5 B, and its valuation appears dramatically stretched with a P/E ratio of 676.0, far above AMD’s 113.9 and NVIDIA’s 43.8. Such an extreme multiple suggests the market is pricing in either a turnaround narrative or significant uncertainty about future earnings, while the lower‑priced peers are viewed as more reasonably valued relative to their earnings streams.
In terms of growth, Intel lags considerably. Revenue is expanding at only 2.8% YoY, compared with AMD’s robust 35.6% and NVIDIA’s stellar 62.5%. The disparity is reflected in operating efficiency as well: Intel’s operating margin sits at 6.3%, roughly half of AMD’s 13.7% and a fraction of NVIDIA’s 63.2%. Profitability is similarly weak; Intel’s net profit margin of 0.4% trails AMD’s 10.3% and NVIDIA’s 53.0%, indicating that Intel is still struggling to convert sales into earnings.
Despite the modest fundamentals, Intel’s stock has outperformed its rivals on a year‑to‑date basis, delivering a 100.59% return versus AMD’s 80.33% and NVIDIA’s 28.0%. The strong YTD performance may reflect investor optimism about upcoming product launches, cost‑cutting initiatives, or a broader market rally in semiconductors, but it also raises the question of whether the price appreciation is justified given the company’s lagging growth and profitability.
Overall, Intel’s key weakness lies in its slower top‑line growth and thin margins, which are reflected in an unusually high P/E ratio that could signal overvaluation or speculative expectations. AMD offers a middle ground with solid growth and improving margins at a more moderate valuation, while NVIDIA stands out as the growth and profitability leader with a comparatively reasonable P/E. Investors must weigh Intel’s recent price gains against its fundamental challenges and consider whether the market’s optimism can translate into sustainable earnings improvements.
Year-to-Date Performance
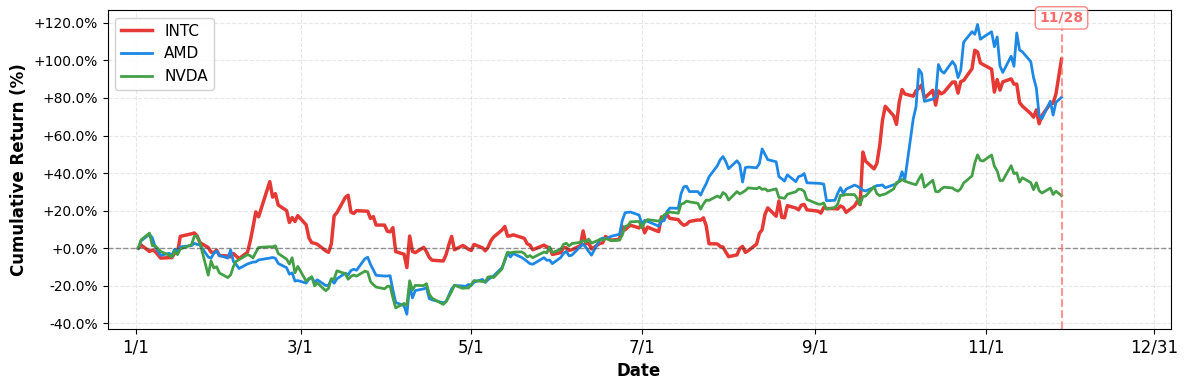
- YTD Performance:
- INTC: +100.59%
- AMD: +80.33%
- NVDA: +28.00%
Risk & Reward
Bullish Case
- Rumored Apple partnership could drive multi‑billion revenue boost, supporting stock rally.
- Operating margin improvement to 8% expected from IDM 2.0 cost cuts.
- Revenue growth accelerating to 5% YoY after recent data‑center product launches.
- Market cap $193.5B provides scale to capture emerging AI semiconductor demand.
Bearish Case
- P/E ratio 676× signals extreme overvaluation relative to earnings currently.
- Profit margin 0.4% indicates weak bottom line despite revenue growth.
- Allegations of stolen TSMC technology could trigger legal costs and reputational risk.
- Operating margin 6.3% lags peers, limiting cash generation for R&D investment.
What to Watch
Short-term (1-2 weeks):
- Verify credibility of rumored Apple/major customer contract through official press releases.
- Watch for SEC filings indicating insider purchases or sales after stock surge.
- Track any regulatory statements regarding alleged TSMC technology theft allegations.
Medium-term (1-3 months):
- Assess impact of confirmed large customer win on Intel’s revenue guidance and margins.
- Follow progress on Intel’s 3nm and 4nm process node rollouts and production yields.
- Evaluate potential legal and financial exposure from TSMC IP dispute settlement.
- Watch competitor pricing and market share shifts as Intel’s stock reacts to rumors.
Disclaimer: This analysis is for informational and educational purposes only and should not be considered investment advice. The information presented is based on publicly available data and represents the author’s analysis as of November 28, 2025. Stock prices are volatile and past performance does not guarantee future results. Always conduct your own research and consult with a qualified financial advisor before making investment decisions. The author may or may not hold positions in the securities discussed.

Leave a comment