[Watch today’s 60-second video summary here: (Feature coming soon)]
📋 Table of Contents
Market Overview
On Friday, November 28, 2025, U.S. equities posted broad gains, driven by strong earnings momentum and a resilient macro backdrop. The S&P 500 climbed 0.54% to 6,849.09, while the Nasdaq Composite rose 0.65% to 23,365.69. The Dow Jones Industrial Average added 0.61% to finish at 47,716.42, underscoring a bullish tone across major sectors. Investors remain cautious ahead of the upcoming Federal Reserve policy meeting, but the day’s performance suggests risk appetite remains intact.
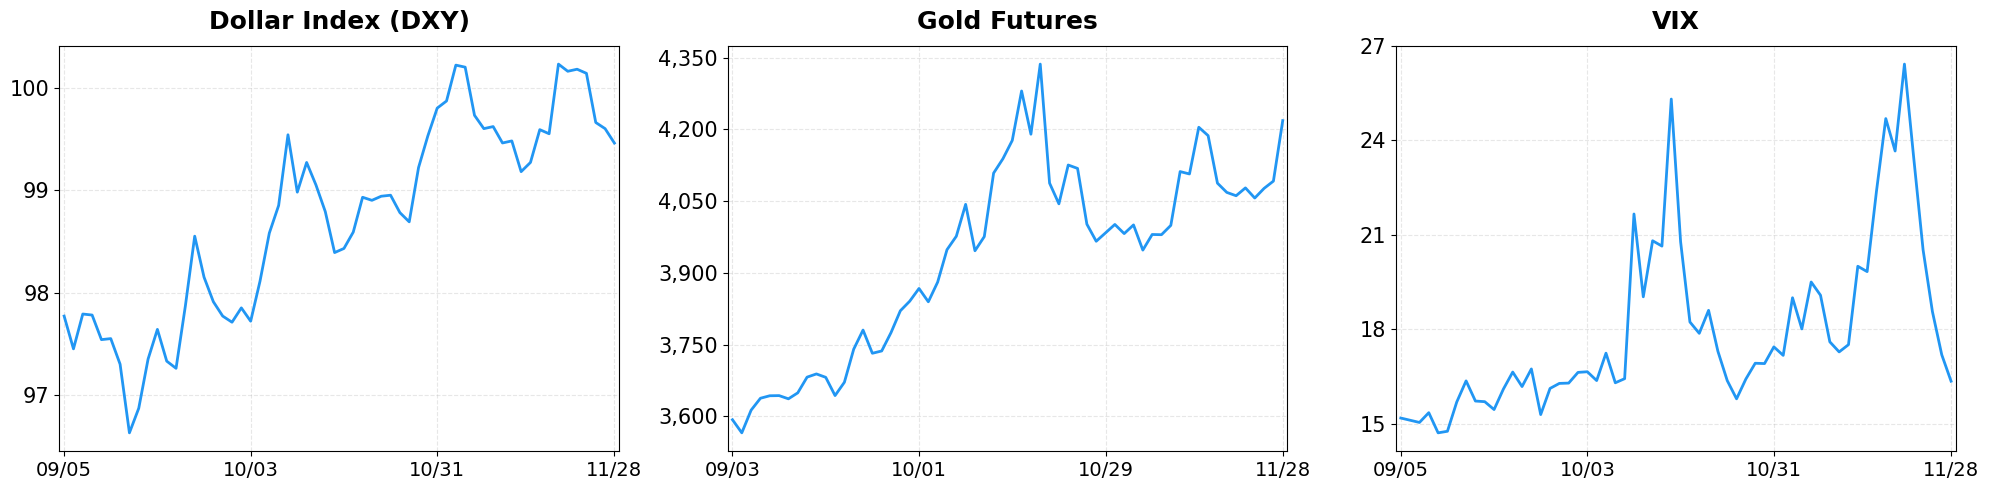
- Dollar Index moved from 99.60 to 99.46 (-0.14%).
- Gold Futures moved from 4091.90 to 4218.30 (+3.09%).
- VIX moved from 17.19 to 16.35 (-4.89%).
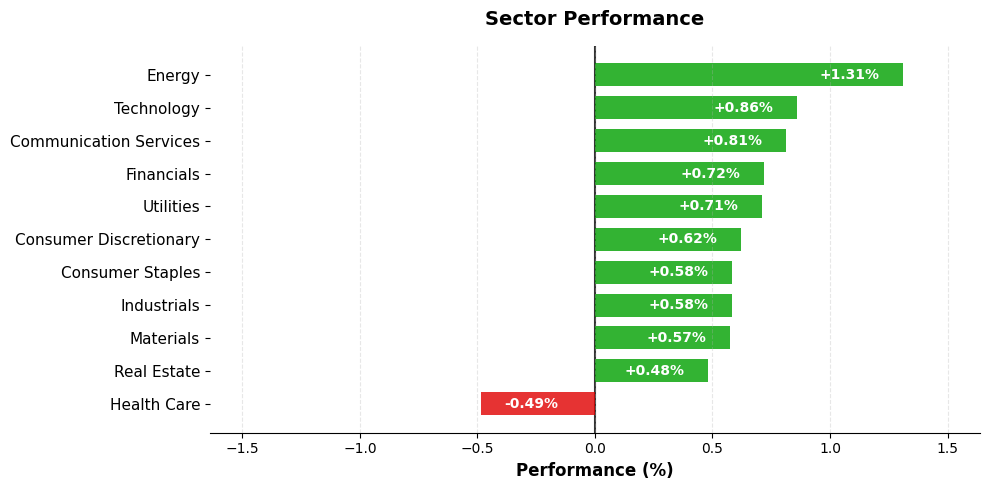
Today’s sector performance shows the following movements:
Market News Highlights
Equity markets showed resilience on Friday as the S&P 500 nudged closer to its all‑time high, buoyed by strong earnings from technology leaders and a renewed appetite for risk assets. The rally was underpinned by optimism surrounding artificial intelligence, with analysts highlighting a competitive “two‑horse race” between the United States and China that could accelerate capital flows into AI‑related stocks. This narrative reinforced buying pressure in semiconductor and cloud computing shares, helping to offset lingering concerns over macro‑policy tightening.
Meanwhile, investors continued to diversify into hard assets amid lingering inflationary pressures and geopolitical uncertainty. Gold, sugar and other commodities were spotlighted as defensive hedges, a theme that dovetailed with the modest upside in equity markets. The combination of a near‑record S&P 500 close and renewed interest in tangible assets suggests a balanced risk‑on/risk‑off sentiment, with market participants positioning for both growth‑driven upside and inflation‑protected safety.
Referenced Articles
- Top portfolio moves for your money as 2025 comes to a close
- US, China are basically in a ‘two-horse race’ around AI
- The case for hard assets like gold, sugar, and more
- Dow Jones Futures: Bulls Rule Big Week: Nvidia Partner Leads Stocks In Buy Zones
- S&P 500 closes near record high on Friday
Index Performance
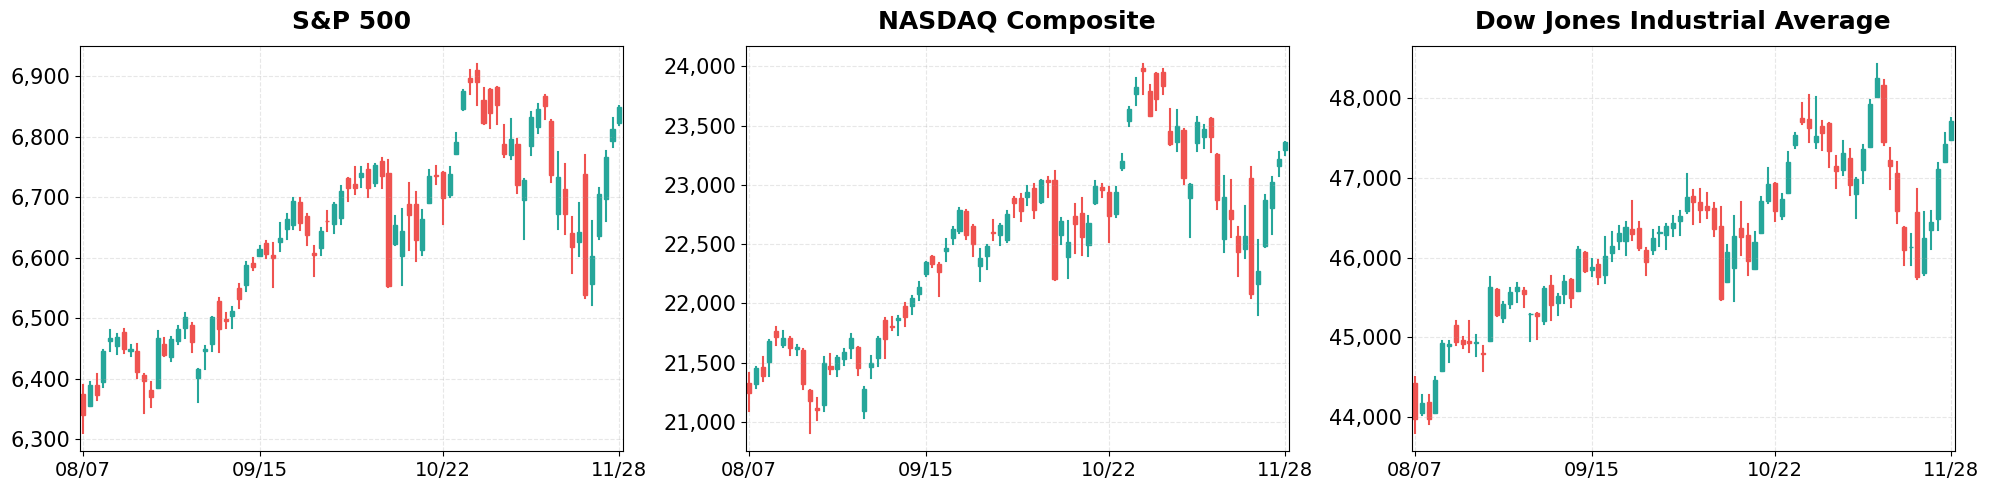
S&P 500 (+0.54%)
The S&P 500’s modest advance reflects renewed investor confidence in technology and consumer discretionary stocks, which outperformed after beating quarterly forecasts. Volume was above average, suggesting sustained buying pressure. Additionally, the energy sector posted a modest rebound as crude prices steadied, providing further support to the broader market.
NASDAQ Composite (+0.65%)
The Nasdaq’s 0.65% gain was propelled by a rally in mega‑cap chipmakers and cloud software firms, buoyed by better‑than‑expected earnings and optimistic guidance. The breadth of the rally remained positive, with more than half of the listed components posting gains. Furthermore, the biotech segment posted gains after positive trial results, adding depth to the technology‑led rally.
Dow Jones Industrial Average (+0.61%)
The Dow’s 0.61% rise was anchored by industrials and financials, where earnings beats and higher dividend yields attracted investors. Defensive sectors also contributed, keeping the index’s momentum broad‑based. Meanwhile, the materials sector posted solid gains on higher commodity prices, reinforcing the overall upward trajectory.
Top Movers
Top Gainers
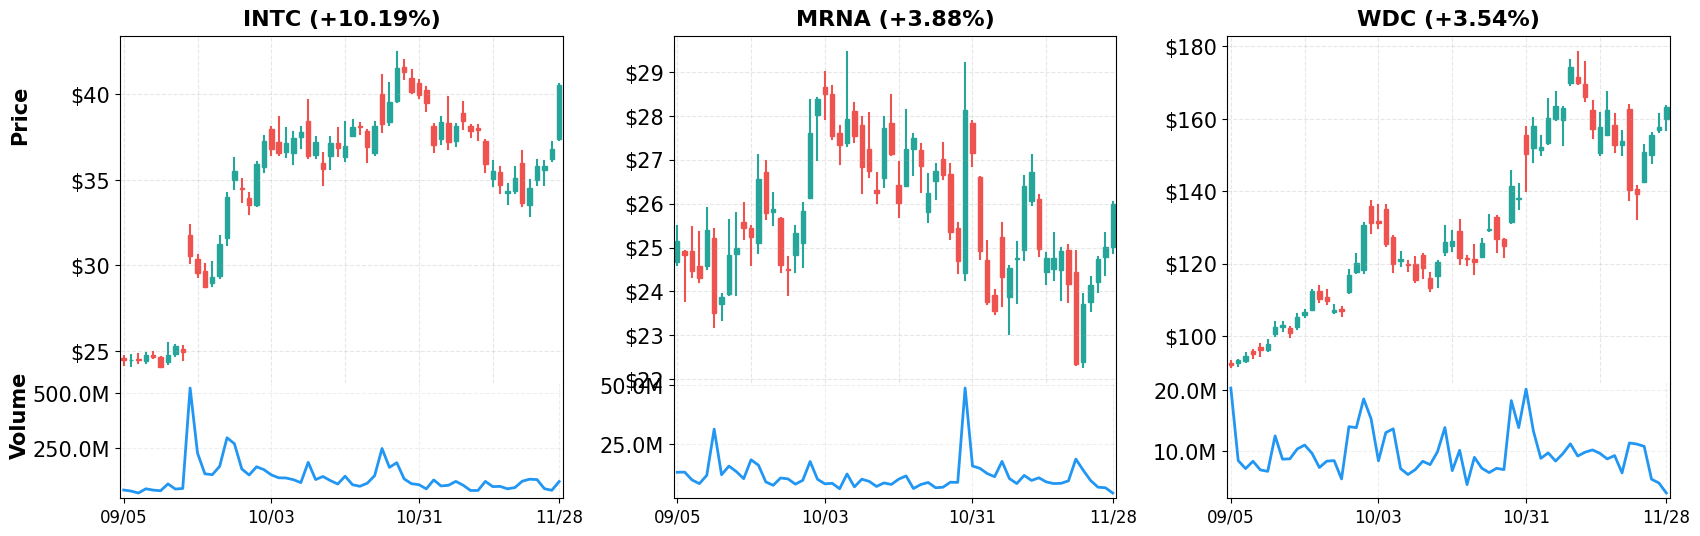
- INTC (+10.19%)
- MRNA (+3.88%)
- WDC (+3.54%)
Top Losers
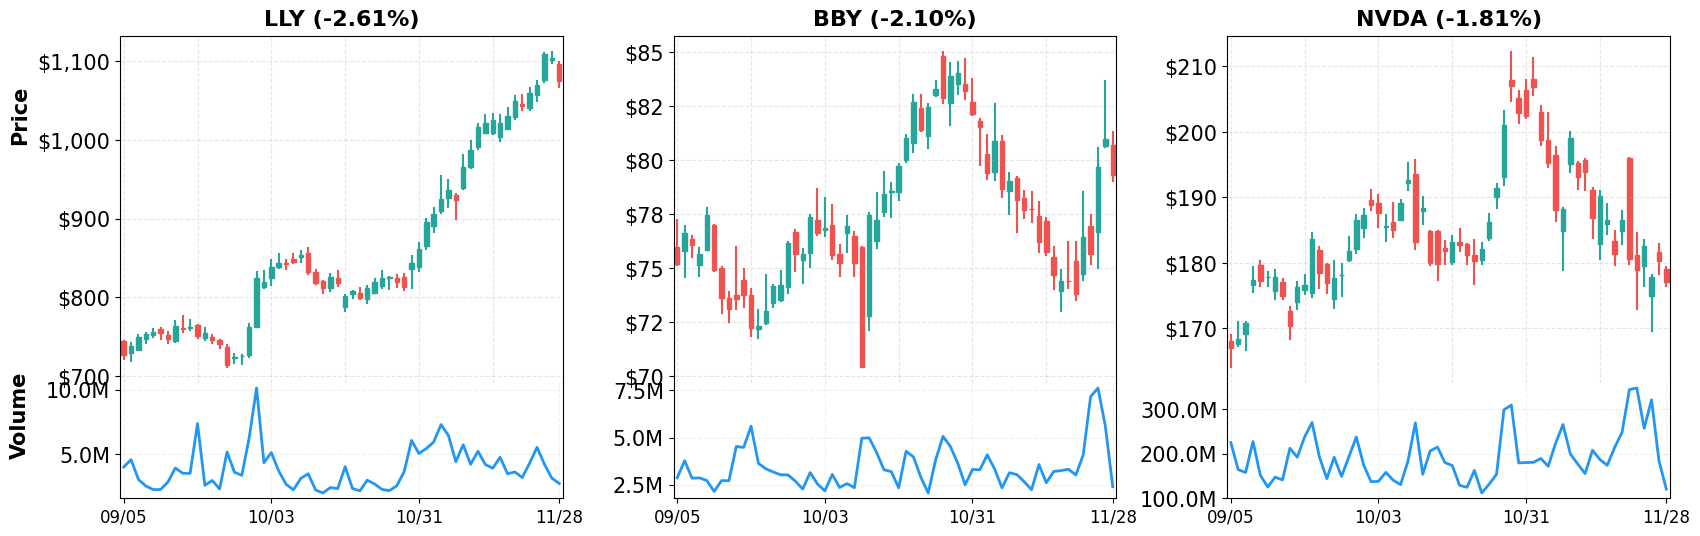
- LLY (-2.61%)
- BBY (-2.10%)
- NVDA (-1.81%)
Magnificent 7
Overview
Performance Comparison: Magnificent 7 vs Major Indices
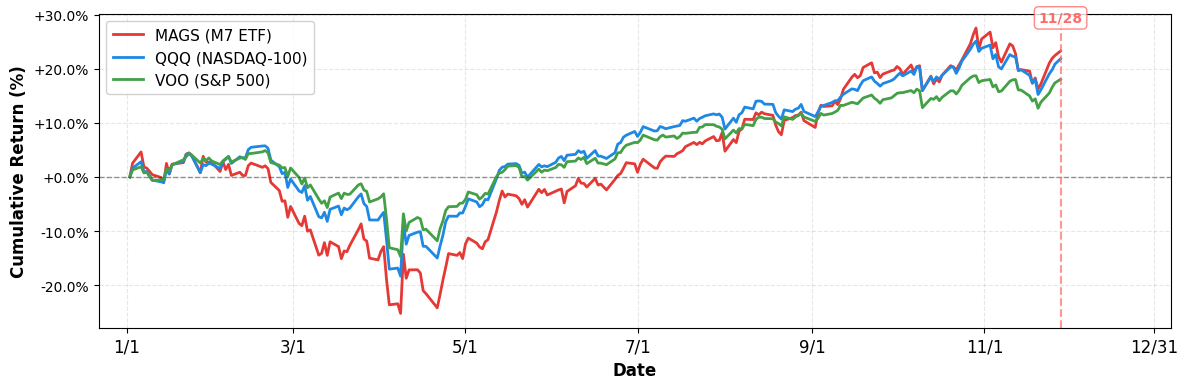
- YTD Performance:
- S&P 500 (VOO): +18.03%
- NASDAQ-100 (QQQ): +21.83%
- Magnificent 7 (MAGS): +23.26%
M7 Total Market Capitalization
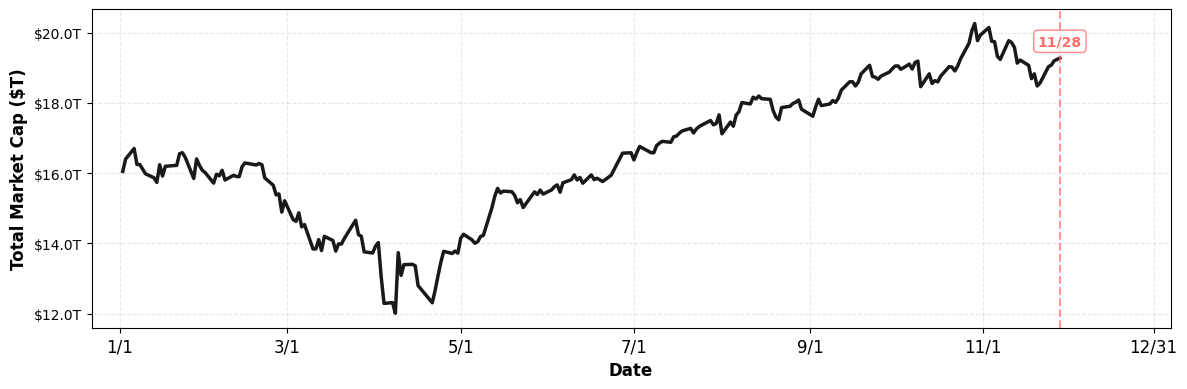
- YTD Market Cap Change:
- $16.05T (1/1) → $19.28T (current), +20.12%
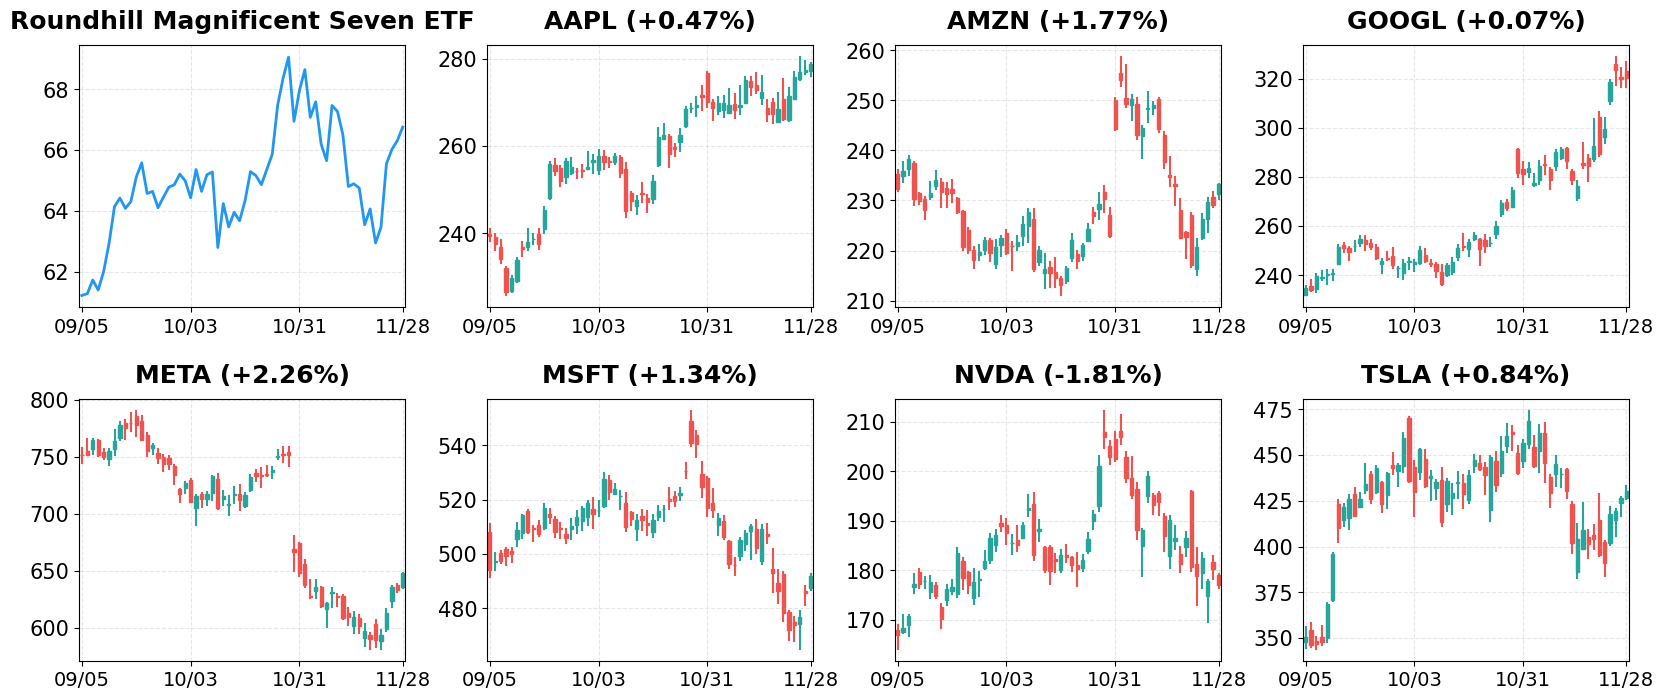
1. AAPL
Price: $278.85 (+0.47%)
- Apple set to become the world’s top phone maker
- S&P 500 Gains and Losses Today: Intel Soars Amid Apple Deal Rumors; Eli Lilly Stock Slides
- Apple’s Ads, Maps Face EU Gatekeeper Test
2. AMZN
Price: $233.22 (+1.77%)
- Amazon vs. Walmart vs. Target: Who Raised Prices Most Under Tariffs?
- Shorting Secured Out-of-the-Money Amazon Puts Works Here
- Amazon Stock Rallies Past Key Level On Black Friday. Thanksgiving Was Heavy On Discounts.
3. GOOGL
Price: $320.18 (+0.07%)
- India’s Adani seeks up to $5 billion investment in Google data center to join AI boom
- AI data centers’ massive demand for aluminum is crushing the US aluminum industry
- Black Friday tech shopping only gets more complicated with AI
4. META
Price: $647.95 (+2.26%)
- Meta Platforms – High EVA Shows Why The Premium Is There
- Meta Platforms Faces Possible Full WhatsApp Ban in Russia as Regulator Escalates Pressure
- AI data centers’ massive demand for aluminum is crushing the US aluminum industry
5. MSFT
Price: $492.01 (+1.34%)
- Google Drops Microsoft EU Antitrust Fight
- Top Midday Stories: Jefferies Under SEC Probe; Qwant Complaint Against Microsoft Dismissed; Oracle, Vantage Seek $38 Billion for OpenAI Sites
- Microsoft (MSFT) Down 7.7% Since Last Earnings Report: Can It Rebound?
6. NVDA
Price: $177.00 (-1.81%)
- Dow Jones Futures: Bulls Rule Big Week: Nvidia Partner Leads Stocks In Buy Zones
- Here’s Why Oracle Is Not the Next Nvidia
- Nvidia rival quietly builds jaw-dropping interest
7. TSLA
Price: $430.17 (+0.84%)
- Tesla Launches FSD v14 Free Trial In North America
- Waymo Could Wreck Tesla’s Most Important Plan
- Why Did Tesla Stock Jump 10% This Week?
Disclaimer: This market briefing is for informational and educational purposes only and should not be considered investment advice. The information presented is based on publicly available data and represents the author’s analysis as of November 28, 2025. Stock prices are volatile and past performance does not guarantee future results. Always conduct your own research and consult with a qualified financial advisor before making investment decisions. The author may or may not hold positions in the securities discussed.

Leave a comment