[Watch today’s 60-second video summary here: (Feature coming soon)]
📋 Table of Contents
Market Overview

U.S. equities posted solid gains on November 26, 2025, as investors digested mixed earnings reports and a modest easing in inflation expectations. Broad-based buying was led by technology and consumer discretionary stocks, while energy lagged amid lower oil prices. The rally lifted all three major benchmarks, underscoring continued risk appetite ahead of the upcoming Federal Reserve meeting.
- Dollar Index moved from 99.66 to 99.59 (-0.07%).
- Gold Futures moved from 4091.90 to 4195.90 (+2.54%).
- VIX moved from 18.56 to 17.16 (-7.54%).
Today’s sector performance shows the following movements:

Market News Highlights
The equity markets posted a strong rally on November 26, 2025, with the Dow, S&P 500, and Nasdaq all posting gains that marked the best four‑day stretch since May. The broad‑based advance reflects renewed risk appetite ahead of the Thanksgiving holiday, bolstered by a series of earnings reports that have largely met or exceeded expectations. Investors are also digesting JPMorgan’s projection that the S&P 500 could reach 7,500 by 2026 – and potentially breach 8,000 if the Federal Reserve continues to ease monetary policy. That forward‑looking optimism has helped sustain the upward momentum, as market participants price in a more accommodative rate environment.
In parallel, the cryptocurrency market showed a notable rebound, with Bitcoin climbing above $90,000. The rally appears tied to the same risk‑on sentiment driving equities, suggesting that capital is flowing back into higher‑yielding assets after a period of caution. Meanwhile, Robinhood’s stock surged 8% after the firm announced a strategic deal to expand its prediction‑markets platform, highlighting diversification efforts that appeal to both retail and institutional investors. On the earnings front, Dell posted a modest gain, whereas Deere and Zscaler experienced declines, underscoring that while the overall market is upbeat, sector‑specific fundamentals continue to shape individual stock performance.
Referenced Articles
- Stock market today: Dow, S&P 500, Nasdaq rally into Thanksgiving, notch best 4-day stretch since May
- Bitcoin rises above $90,000 as cryptocurrency attempts recovery amid stock market gains
- Robinhood stock jumps 8% as company strikes deal to expand booming prediction markets business
- JPMorgan sees S&P 500 reaching 7,500 in 2026 — or surging past 8,000 if the Fed keeps cutting rates
- Earnings live: Dell stock rises, Deere and Zscaler slide in last major earnings day this week
Index Performance
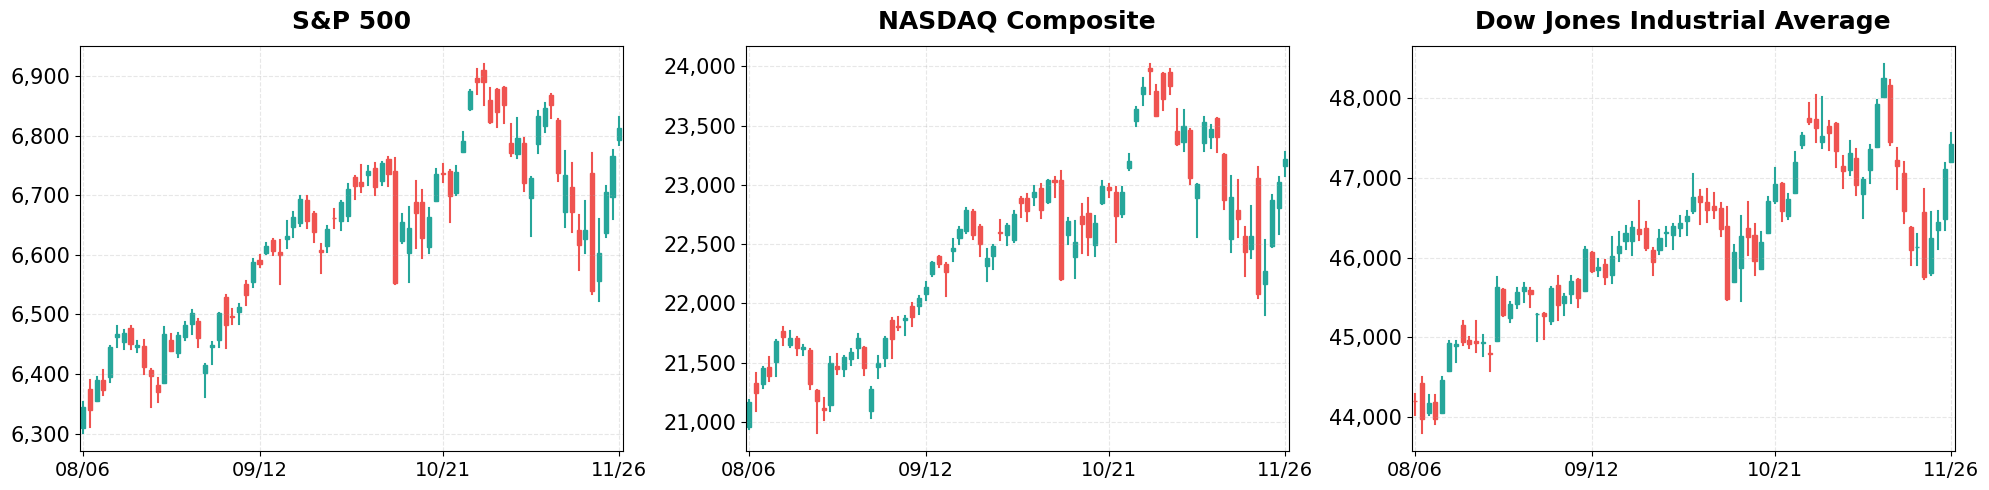
S&P 500 (+0.69%)
The S&P 500 closed at 6,812.61, climbing 46.73 points, as mega‑cap names such as Apple and Microsoft posted earnings beats that reinforced the index’s upward trajectory. Sector weightings in information technology and communication services drove the bulk of the advance, helping the broad market offset weakness in energy and utilities.
NASDAQ Composite (+0.82%)
The Nasdaq Composite rose to 23,214.69, up 189.10 points, propelled by strong performance in semiconductor manufacturers and cloud‑computing firms that outperformed consensus forecasts. The index’s 0.82% gain reflects heightened investor confidence in growth‑oriented stocks, even as valuation concerns linger in the high‑beta segment.
Dow Jones Industrial Average (+0.67%)
The Dow Jones Industrial Average finished at 47,427.12, adding 314.67 points, with industrial titans like Boeing and Caterpillar posting better‑than‑expected revenue, supporting the industrial sector’s momentum. Despite a modest lag in financials, the overall 0.67% rise demonstrates that blue‑chip stocks remain a cornerstone of market breadth on Wednesday.
Top Movers
Top Gainers

- HOOD (+10.93%)
- TER (+6.98%)
- DELL (+5.81%)
Top Losers

- ZS (-13.03%)
- WDAY (-7.85%)
- DE (-5.76%)
Magnificent 7
Overview

Performance Comparison: Magnificent 7 vs Major Indices
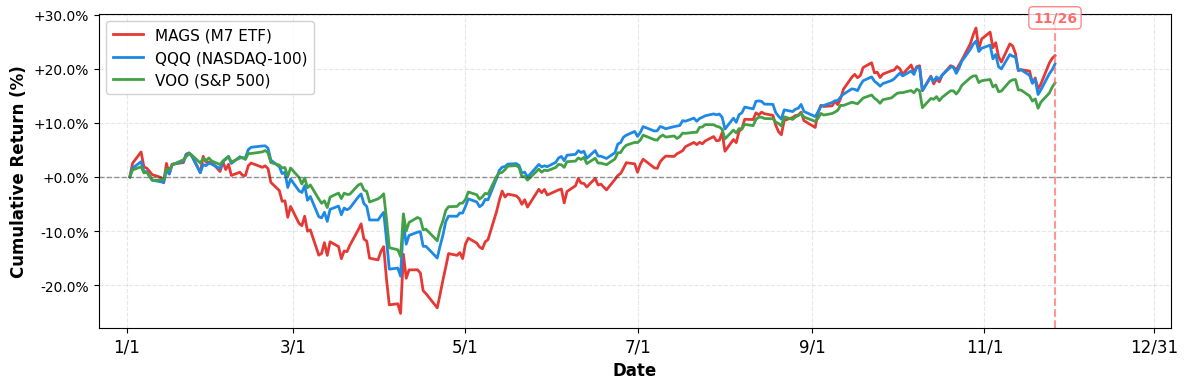
- YTD Performance:
- S&P 500 (VOO): +17.37%
- NASDAQ-100 (QQQ): +20.85%
- Magnificent 7 (MAGS): +22.39%
M7 Total Market Capitalization

- YTD Market Cap Change:
- $16.05T (1/1) → $19.20T (current), +19.63%
1. AAPL
Price: $277.55 (+0.21%)
- Apple contests India’s antitrust penalty law with risk of $38 billion fine, filing shows
- Stock market today: Dow, S&P 500, Nasdaq rally into Thanksgiving, notch best 4-day stretch since May
- Top 10 stock picks of 2025 from Wedbush’s Dan Ives
2. AMZN
Price: $229.16 (-0.22%)
- Is Amazon.com (AMZN) One of The Best Quantum Computing Stocks to Invest In Right Now?
- Panasonic Energy to supply batteries to Amazon-backed Zoox
- Flight Of The Hyperscalers. How AI Sent Amazon, Google, Oracle, Microsoft, Meta On A Wild Ride
3. GOOGL
Price: $319.95 (-1.08%)
- Don’t chase Google’s highs; consider other Big Tech AI laggards
- Small-caps, Alphabet’s path to $4T, healthcare: Market Takeaways
- Flight Of The Hyperscalers. How AI Sent Amazon, Google, Oracle, Microsoft, Meta On A Wild Ride
4. META
Price: $633.61 (-0.41%)
- Flight Of The Hyperscalers. How AI Sent Amazon, Google, Oracle, Microsoft, Meta On A Wild Ride
- Tech analyst Dan Ives flags 10 stocks to own, insists there’s no AI bubble
- Nvidia says it isn’t using ‘circular financing’ schemes. 2 famous short sellers disagree.
5. MSFT
Price: $485.50 (+1.78%)
- Baird Begins Coverage of Microsoft (MSFT) Stock
- Flight Of The Hyperscalers. How AI Sent Amazon, Google, Oracle, Microsoft, Meta On A Wild Ride
- Microsoft Expands Solar Investments Across Latin America and Europe
6. NVDA
Price: $180.26 (+1.37%)
- Stocks rebound, Dell and HP earnings, Nvidia: 3 Things
- Nvidia says it isn’t using ‘circular financing’ schemes. 2 famous short sellers disagree.
- Evercore ISI Raises PT on NVIDIA (NVDA) Stock
7. TSLA
Price: $426.58 (+1.71%)
- Tesla Rises As Elon Musk Makes This Austin Robotaxi Claim
- ‘These Chips Will Profoundly Change the World’ and ‘Save Lives.’ Elon Musk Doubles Down on AI Chips as TSLA Stock Stagnates YTD.
- Stock market today: Dow, S&P 500, Nasdaq rally into Thanksgiving, notch best 4-day stretch since May
Disclaimer: This market briefing is for informational and educational purposes only and should not be considered investment advice. The information presented is based on publicly available data and represents the author’s analysis as of November 26, 2025. Stock prices are volatile and past performance does not guarantee future results. Always conduct your own research and consult with a qualified financial advisor before making investment decisions. The author may or may not hold positions in the securities discussed.

Leave a comment