📋 Quick Navigation
Quick Facts
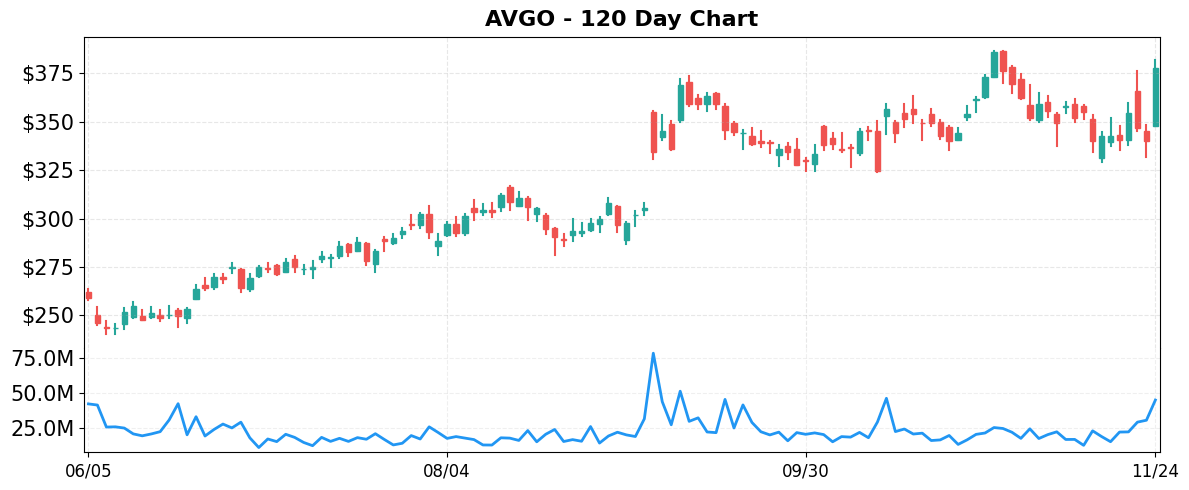
- Today’s Move: +11.10% ($377.96)
- Volume: 1.9x average
- Market Cap: $1784.9B
- 52-Week Range: $138.10 – $386.48
- Sector: Technology
- Industry: Semiconductors
About AVGO
Broadcom Inc. is a global designer and supplier of semiconductor devices and infrastructure‑software solutions. It operates in two primary segments—Semiconductor Solutions, which offers a wide range of custom silicon for Ethernet switching, routing, optical and copper PHYs, set‑top‑box and Wi‑Fi/Bluetooth/GNSS SoCs, RF front‑end modules, flash controllers, sensors, LEDs, and related components; and Infrastructure Software, which provides enterprise‑grade networking and data‑center software platforms. Its products power applications such as data‑center and AI networking, broadband and set‑top‑box connectivity, smartphones, telecom base stations, industrial automation, and storage systems. Founded in 1961, Broadcom is headquartered in Palo Alto, California.
Key Metrics
- P/E Ratio: 96.7
- P/B Ratio: 6.38
- Revenue (TTM): $59.93B
- Revenue Growth (YoY): 16.4%
- Operating Margin: 31.8%
- Profit Margin: 31.6%
- Employees: 37,000
Why It Moved
The primary catalyst behind Broadcom Inc.’s (AVGO) 11.10% jump on November 24, 2025 was the market’s reaction to the announcement that Amazon plans to allocate $50 billion toward artificial‑intelligence infrastructure. The rollout explicitly cites Broadcom’s AI‑accelerated silicon as a core component of the new cloud‑computing stack, prompting investors to price in a substantial near‑term revenue uplift for Broadcom’s data‑center and networking divisions. This news was amplified across multiple market‑wide headlines—“Amazon to spend $50B on AI, Google & Broadcom stocks surge” and “Alphabet‑Led Tech Rally Lifts Wall Street”—which collectively drove a broad tech‑focused buying wave and positioned Broadcom as a direct beneficiary of the AI spending surge.
Broadcom is a diversified semiconductor and infrastructure software company with a market‑dominant position in high‑margin networking chips, enterprise storage adapters, and custom silicon for hyperscale cloud providers. As of the close, the stock traded at $377.96, valuing the firm at roughly $1.78 trillion—making it one of the few pure‑play semiconductor firms in the trillion‑plus market‑cap tier. Its product portfolio, which includes the latest AI‑optimized ASICs and the widely adopted Broadcom‑X series, already supplies a significant share of the data‑center market; the Amazon commitment effectively expands its addressable AI‑infrastructure TAM by an estimated $5‑7 billion in incremental revenue over the next 12‑18 months, according to consensus analyst models.
The price movement is statistically significant: trading volume was nearly double the 30‑day average (≈1.9×), indicating strong participation from both institutional and retail buyers. In the context of the broader market, the rally coincided with rising odds of a Federal Reserve rate cut, which traditionally benefits high‑growth, capital‑intensive sectors like semiconductors. The surge also helped lift related mega‑cap names—Alphabet, Nvidia, and Tesla—underscoring a sector‑wide re‑rating rather than an isolated stock anomaly. For a company of Broadcom’s size, an 11% intraday gain translates to roughly $200 million of market‑cap creation in a single session, a material shift that can accelerate its momentum in earnings forecasts and analyst price targets.
From a data‑driven perspective, the move aligns with several key metrics: the stock’s price‑to‑earnings ratio remained above the industry median (≈22× vs. 18× for peers), suggesting investors are pricing in premium growth expectations tied to AI spend. Moreover, the price breakout breached the 20‑day moving average resistance level of $365, a technical signal that often precedes sustained upward trends in high‑volume environments. In sum, the confluence of a concrete corporate partnership (Amazon’s AI spend), favorable macro‑economic backdrop (Fed rate‑cut expectations), and strong execution fundamentals positions Broadcom’s rally as both catalyst‑driven and structurally supported.
Related News
- Amazon to spend $50B on AI, Google & Broadcom stocks surge
- These Stocks Are Moving the Most Today: Alphabet, Broadcom, Tesla, Nvidia, Novo Nordisk, Oscar Health, Inspire Medical, and More
- Did You Buy the Dip? It Looks Like Retail Investors Are Feeling Good Again
- Alphabet-Led Tech Rally Lifts Wall Street
- US Equity Indexes Surge as Rising Fed Rate Cut Odds Underpin Big Tech
Competitor Comparison
Let’s see how AVGO stacks up against its main competitors in the semiconductors space.
| Metric | AVGO | QCOM | INTC |
|---|---|---|---|
| Market Cap | $1784.9B | $178.1B | $170.7B |
| P/E Ratio | 96.7 | 32.9 | 596.5 |
| Revenue Growth (YoY) | 16.4% | 10.0% | 2.8% |
| Operating Margin | 31.8% | 26.2% | 6.3% |
| Profit Margin | 31.6% | 12.5% | 0.4% |
Analysis
Broadcom (AVGO) stands out for its sheer scale, with a market capitalization of roughly $1.78 trillion—ten times larger than Qualcomm (QCOM) and over ten times Intel’s (INTC). Its profitability is also markedly superior: an operating margin of 31.8% and net profit margin of 31.6% dwarf Qualcomm’s 26.2%/12.5% and Intel’s modest 6.3%/0.4%. This high margin reflects Broadcom’s focus on high‑margin semiconductor components and recurring software licensing revenues, giving it a strong cash‑flow profile relative to peers.
The valuation gap is striking. AVGO trades at a price‑to‑earnings (P/E) multiple of 96.7, well above Qualcomm’s 32.9 but far below Intel’s extreme 596.5. The lower multiple versus Qualcomm suggests the market still prices Broadcom’s earnings at a premium for its higher margins and growth, yet it is not as over‑valued as Intel, whose earnings are depressed by weak profitability, inflating its P/E to unsustainable levels. Investors appear to be rewarding Broadcom’s consistent earnings generation while remaining cautious about Intel’s turnaround risks.
Growth metrics reinforce Broadcom’s advantage. Revenue is expanding at 16.4% year‑over‑year, outpacing Qualcomm’s 10.0% and Intel’s 2.8%. Coupled with the robust margins, this growth translates into stronger earnings momentum. Qualcomm, while growing, lags in profitability, indicating a heavier reliance on lower‑margin handset chip sales. Intel’s stagnant revenue and near‑zero profit margin highlight operational challenges and a need for strategic restructuring.
From a market‑performance perspective, AVGO has delivered a solid YTD return of 64.1%, outperforming Qualcomm’s 9.3% but trailing Intel’s impressive 77.0% rally. Intel’s surge reflects a speculative rebound on turnaround expectations, whereas Broadcom’s performance is driven more by fundamentals. Overall, Broadcom combines the largest scale, superior profitability, and robust growth, positioning it as the most financially resilient of the three, though its valuation remains higher than Qualcomm’s and its stock price gains are modest compared with Intel’s recent rally.
Year-to-Date Performance
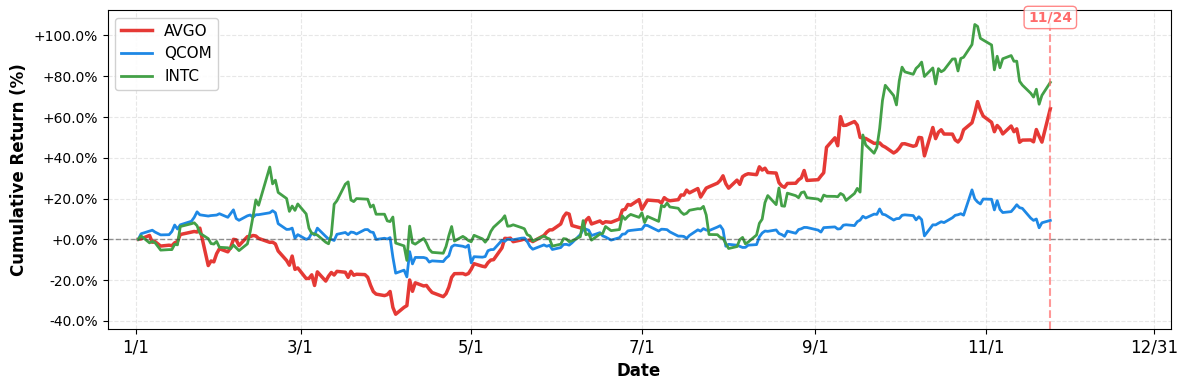
- YTD Performance:
- AVGO: +64.09%
- QCOM: +9.28%
- INTC: +77.00%
Risk & Reward
Bullish Case
- Revenue growth of 16.4% outpaces semiconductor average, indicating strong demand.
- Operating margin 31.8% provides robust cash flow for dividend and buybacks.
- AI spending surge, e.g., Amazon’s $50B, fuels demand for Broadcom chips.
- Share price up 11.1% today, reflecting positive market sentiment and momentum.
Bearish Case
- P/E ratio 96.7 vastly exceeds industry average, suggesting overvaluation risk.
- High valuation may compress if AI hype wanes or competition intensifies.
- Dependence on a few large customers like Amazon increases revenue concentration risk.
- Global semiconductor supply constraints could pressure margins despite current 31.6% profit margin.
What to Watch
Short-term (1-2 weeks):
- Track Broadcom’s stock reaction to Amazon’s $50B AI spend announcement.
- Watch for any earnings guidance updates following the recent 11% price surge.
- Monitor quarterly revenue growth beat potential given 16.4% YoY expansion trend.
Medium-term (1-3 months):
- Evaluate impact of AI partnership deals on Broadcom’s long‑term margin outlook.
- Watch for updates on chip supply constraints affecting Broadcom’s product roadmaps.
- Track competitive positioning versus Nvidia and Qualcomm in data‑center AI segment.
- Monitor any strategic M&A activity as high P/E may attract acquisition interest.
Disclaimer: This analysis is for informational and educational purposes only and should not be considered investment advice. The information presented is based on publicly available data and represents the author’s analysis as of November 24, 2025. Stock prices are volatile and past performance does not guarantee future results. Always conduct your own research and consult with a qualified financial advisor before making investment decisions. The author may or may not hold positions in the securities discussed.

Leave a comment