[Watch today’s 60-second video summary here: Youtube Shorts ]
📋 Table of Contents
Market Overview
The U.S. equity markets posted a robust rally on November 24, 2025, with all major indices ending higher. Investor sentiment was buoyed by strong earnings from technology firms and a dovish tone from the Federal Reserve, which helped lift risk appetite. Volume was moderate, suggesting the gains were broadly supported across sectors.
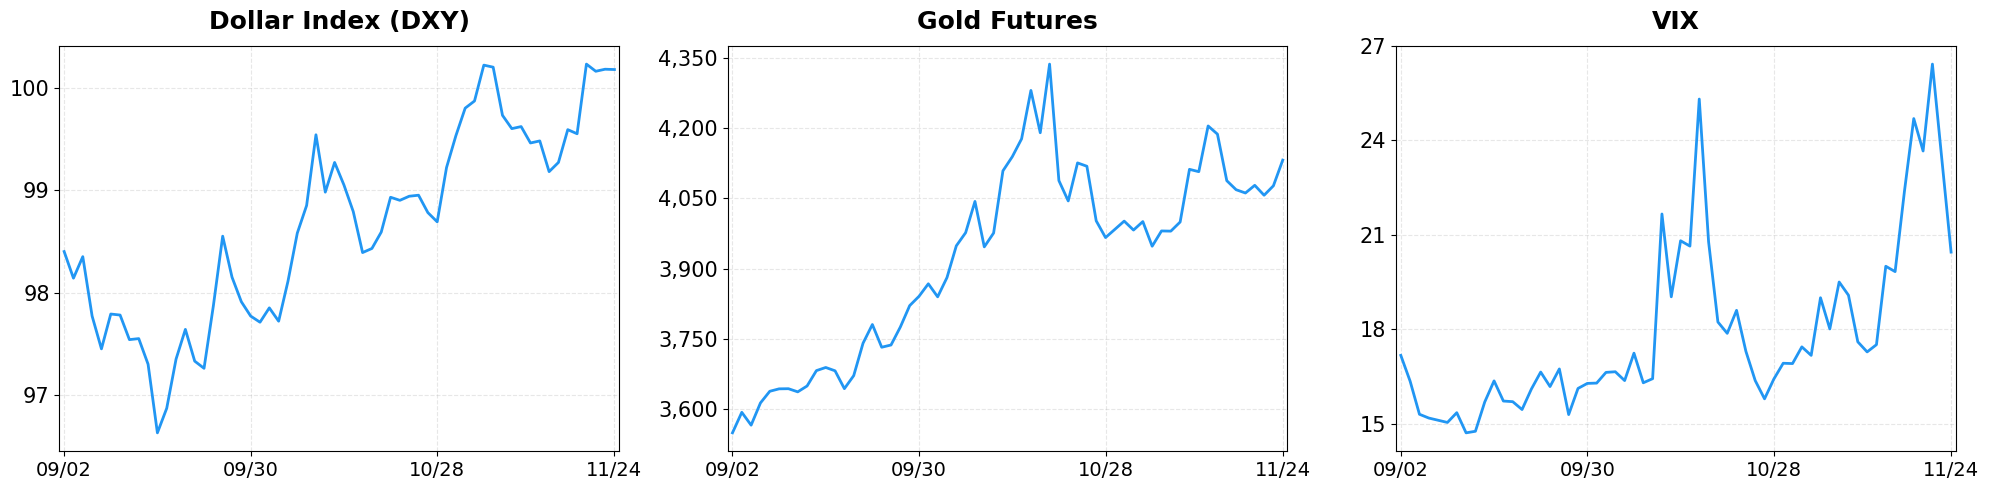
- Dollar Index moved from 100.18 to 100.18 (-0.00%).
- Gold Futures moved from 4076.70 to 4131.70 (+1.35%).
- VIX moved from 23.43 to 20.51 (-12.46%).
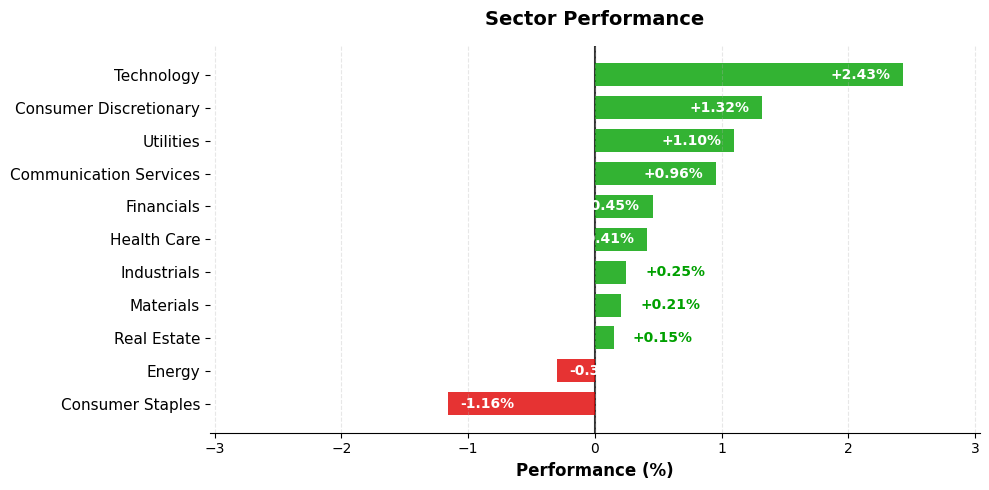
Today’s sector performance shows the following movements:
Market News Highlights
The equity markets posted a pronounced surge on Monday, with the Nasdaq registering its largest single‑day gain since May and the S&P 500 climbing sharply. The rally was anchored by heavyweight tech names such as Alphabet and Tesla, which helped lift the broader communication services and technology sectors. The momentum appears to be driven by renewed investor confidence in growth stocks after a period of volatility, as well as expectations that the Federal Reserve’s recent policy stance will remain accommodative in the near term.
Meanwhile, Moderna emerged as the most shorted stock within the S&P 500, signaling heightened bearish sentiment toward the biotech firm. The elevated short interest may reflect concerns over upcoming product pipelines and pricing pressures, but it also creates the potential for a short‑squeeze if positive data or earnings surprises materialize. In parallel, market participants are scanning for the next catalyst, with AI developments, Fed commentary, and consumer‑spending trends highlighted as key drivers that could shape short‑term direction.
Looking ahead, the holiday‑shortened week will feature a mix of economic releases and retail earnings that could add volatility. Analysts are watching for data on consumer confidence and inflation, as well as earnings from major retailers that will test the resilience of discretionary spending. The combination of strong tech performance, a notable short‑interest story, and the prospect of fresh macro data suggests that market momentum may remain robust, though the underlying narrative could shift quickly if new information diverges from current expectations.
Referenced Articles
- Stock market today: Nasdaq sees biggest jump since May, S&P 500 soars as Alphabet, Tesla lead tech rally
- Moderna is the S&P 500’s most shorted stock: Here’s why
- AI, Fed, consumer spending: What’s the next market catalyst?
- Economic data returns, retail earnings feature in holiday-shortened week: What to watch this week
- US Equity Indexes Soar as Fed Sugar High Sends Communication Services, Technology Flying
Index Performance
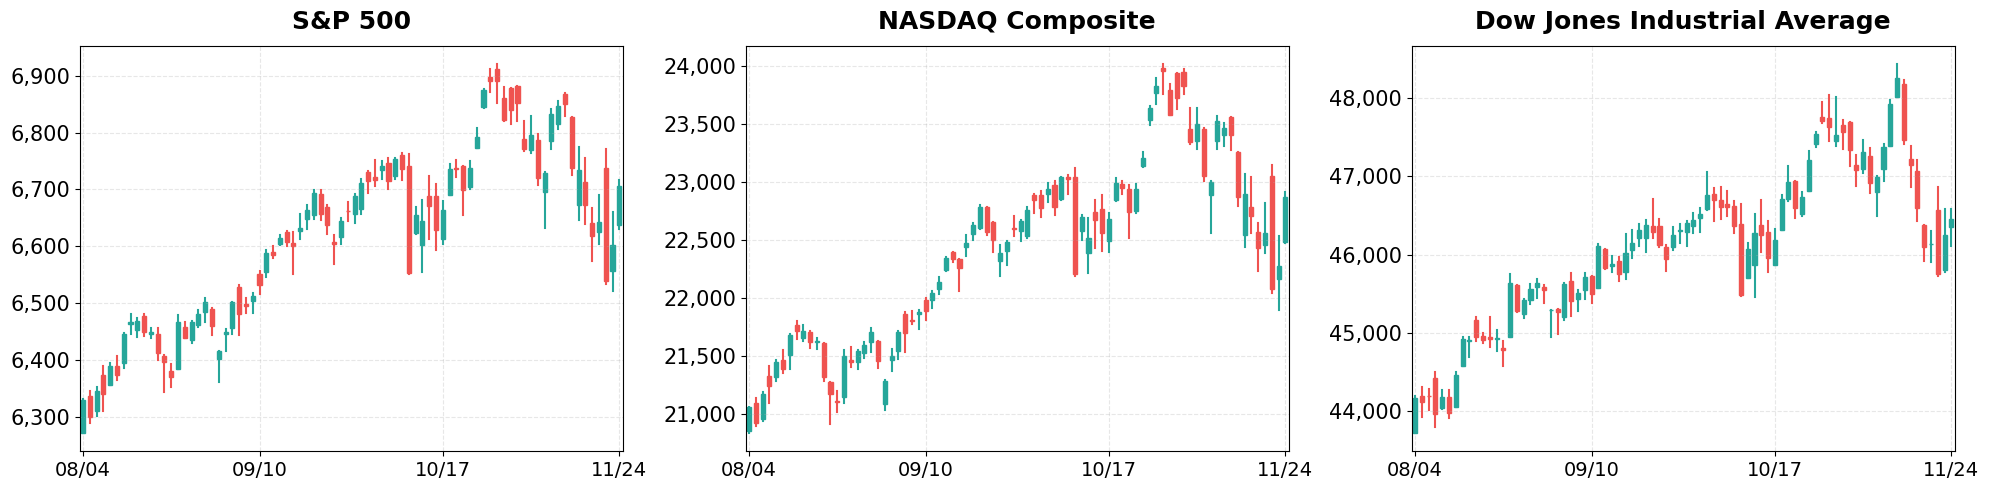
S&P 500 (+1.55%)
The S&P 500 closed at 6,705.12, up 102.13 points, as consumer discretionary and industrial stocks led the advance. The breadth of the rally indicates that the broader market is participating, not just a handful of mega‑caps. Energy stocks also posted gains, offsetting a slight pullback in utilities, which kept the index’s momentum steady.
NASDAQ Composite (+2.69%)
The Nasdaq surged to 22,872.01, gaining 598.93 points, driven by a wave of earnings beats in the semiconductor and cloud‑computing sectors. The index’s outperformance underscores the continued premium placed on growth‑oriented technology names. The rally was further reinforced by a bounce in biotech, which climbed on positive trial data, adding depth to the tech‑led surge.
Dow Jones Industrial Average (+0.44%)
The Dow finished at 46,448.27, up 202.86 points, with industrials and financials providing modest support. While the gain was modest relative to the Nasdaq, it reflects a balanced contribution from traditional blue‑chip constituents. Materials also contributed, with steel producers rising on higher commodity prices, helping to sustain the modest gain.
Top Movers
Top Gainers
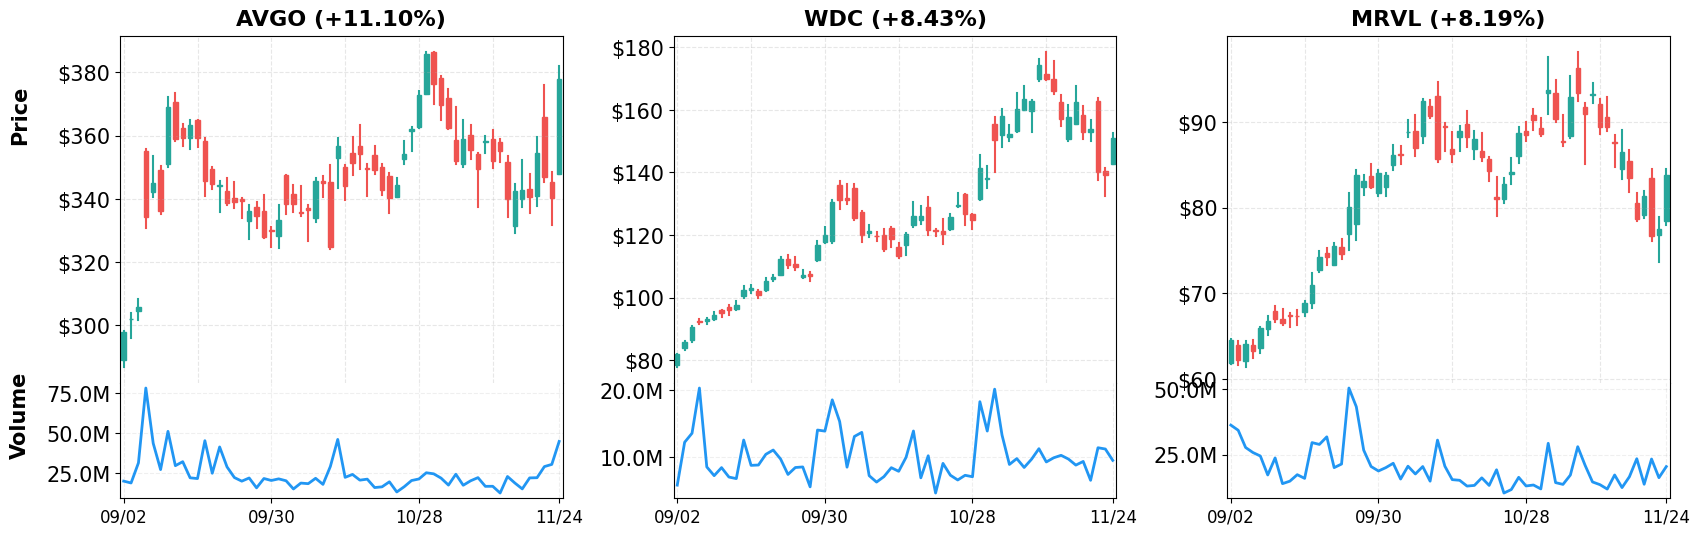
- AVGO (+11.10%)
- WDC (+8.43%)
- MRVL (+8.19%)
Top Losers
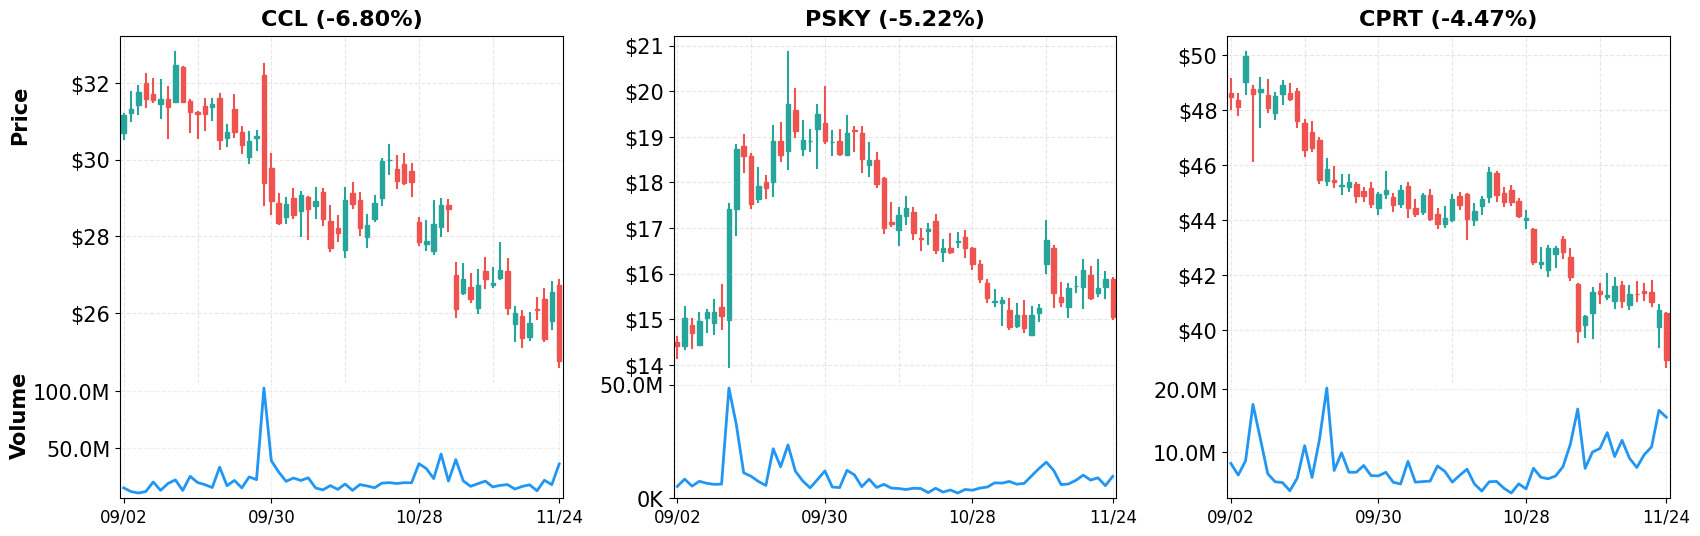
- CCL (-6.80%)
- PSKY (-5.22%)
- CPRT (-4.47%)
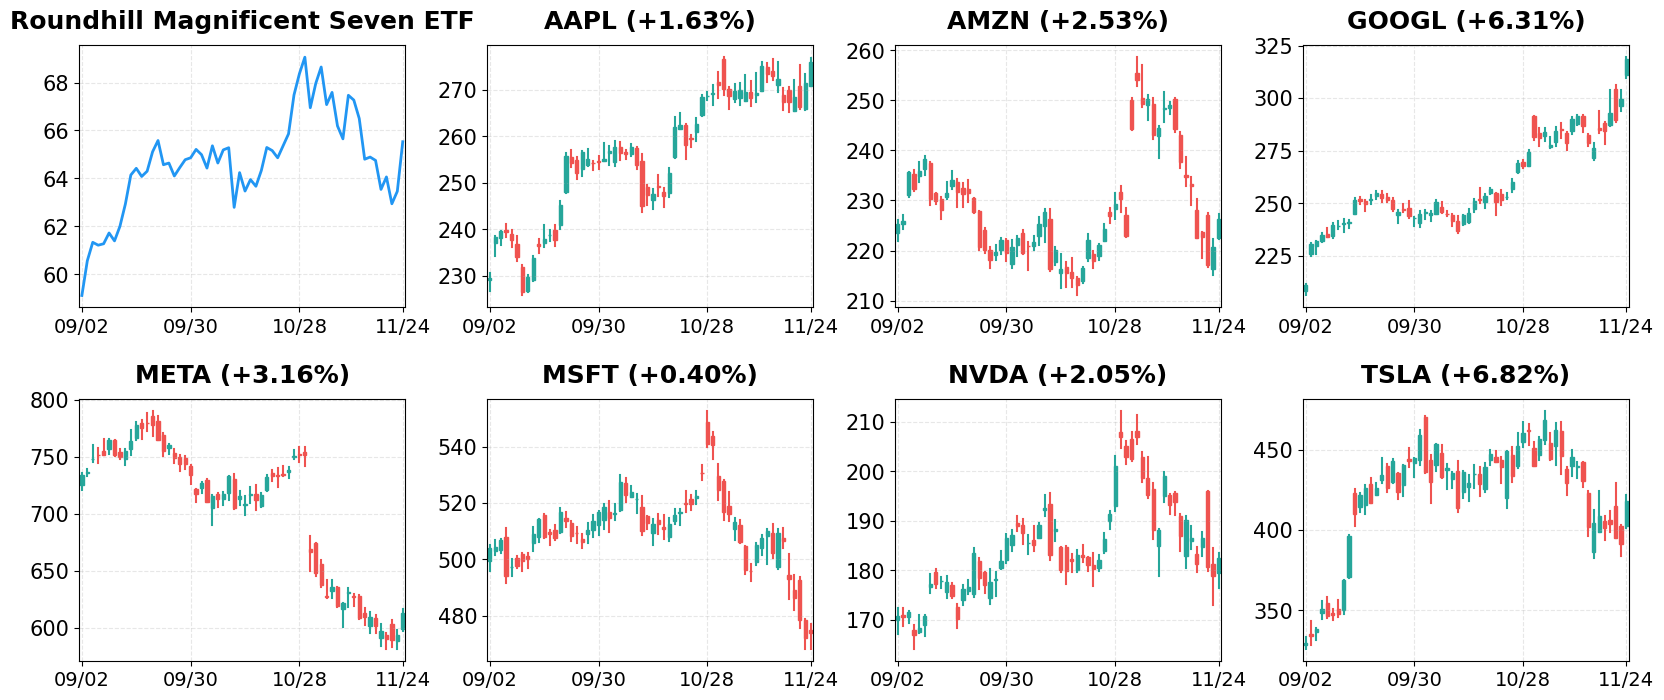
Magnificent 7
Overview
Performance Comparison: Magnificent 7 vs Major Indices
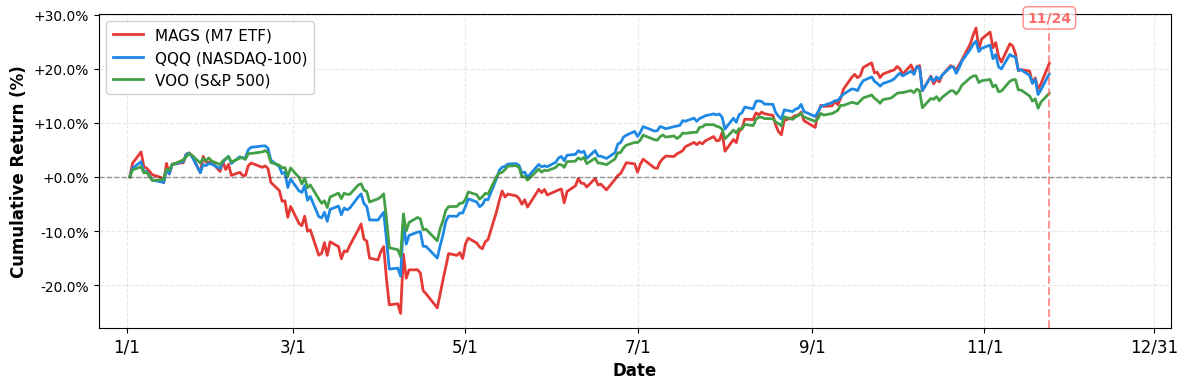
- YTD Performance:
- S&P 500 (VOO): +15.46%
- NASDAQ-100 (QQQ): +19.05%
- Magnificent 7 (MAGS): +20.99%
M7 Total Market Capitalization
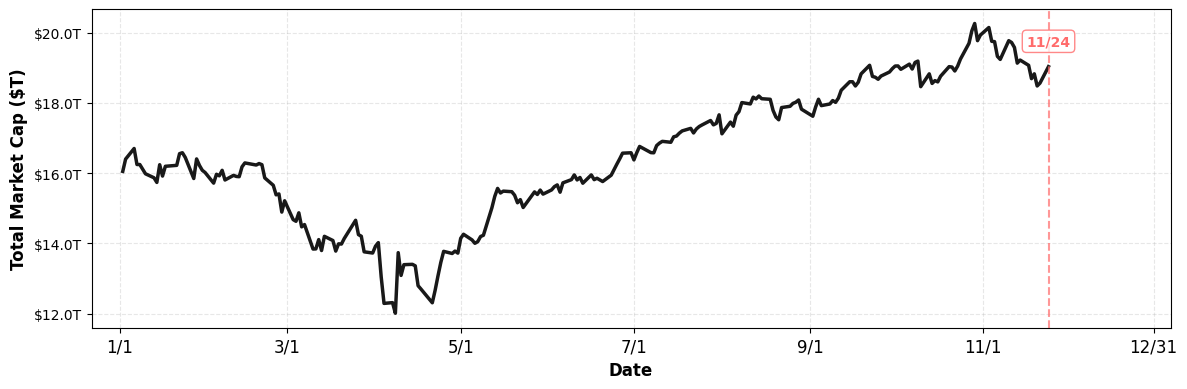
- YTD Market Cap Change:
- $16.05T (1/1) → $19.03T (current), +18.57%
1. AAPL
Price: $275.92 (+1.63%)
- Apple’s presumptive future CEO, John Ternus, has a tough act to follow
- Apple cuts jobs across sales team
- Apple Cuts Jobs Across Its Sales Organization in Rare Layoff
2. AMZN
Price: $226.28 (+2.53%)
- Amazon to invest $15 billion in Indiana to boost data center infrastructure
- Amazon Data Center Tally Tops 900, Documents Show
- Amazon’s AWS Footprint Appears Far Larger Than Thought
3. GOOGL
Price: $318.58 (+6.31%)
- Stock market today: Nasdaq sees biggest jump since May, S&P 500 soars as Alphabet, Tesla lead tech rally
- Amazon to spend $50B on AI, Google & Broadcom stocks surge
- Can Alphabet’s Gemini 3 Overtake ChatGPT?
4. META
Price: $613.05 (+3.16%)
- Is Meta Stock a Buy After Its Recent Drop From Glory?
- Anthropic launches Claude Opus 4.5 as Google’s Gemini 3 gains big backers
- Amazon to invest $15 billion in Indiana to boost data center infrastructure
5. MSFT
Price: $474.00 (+0.40%)
- Amazon to invest $50 billion in data centers to power US government AI efforts
- Amazon to invest $15 billion in Indiana to boost data center infrastructure
- Stock Market Today: Nasdaq Pops, Tesla Surges Amid This AI Boast By Elon Musk (Live Coverage)
6. NVDA
Price: $182.55 (+2.05%)
- Alibaba’s Qwen AI draws 10M downloads, Trump-Nvidia latest
- Nvidia: There Was a Red Flag in Its Earnings Report, but Is the Stock Still a Buy?
- As AI Stocks Like Nvidia Get Tarnished, This Gem Looks To Shine
7. TSLA
Price: $417.78 (+6.82%)
- Stock market today: Nasdaq sees biggest jump since May, S&P 500 soars as Alphabet, Tesla lead tech rally
- Stock Market Today: Nasdaq Pops, Tesla Surges Amid This AI Boast By Elon Musk (Live Coverage)
- Tesla Flagged as a ‘Must Own’ by Melius as Autonomy Nears Major Shift
Disclaimer: This market briefing is for informational and educational purposes only and should not be considered investment advice. The information presented is based on publicly available data and represents the author’s analysis as of November 24, 2025. Stock prices are volatile and past performance does not guarantee future results. Always conduct your own research and consult with a qualified financial advisor before making investment decisions. The author may or may not hold positions in the securities discussed.

Leave a comment