📋 Quick Navigation
Quick Facts
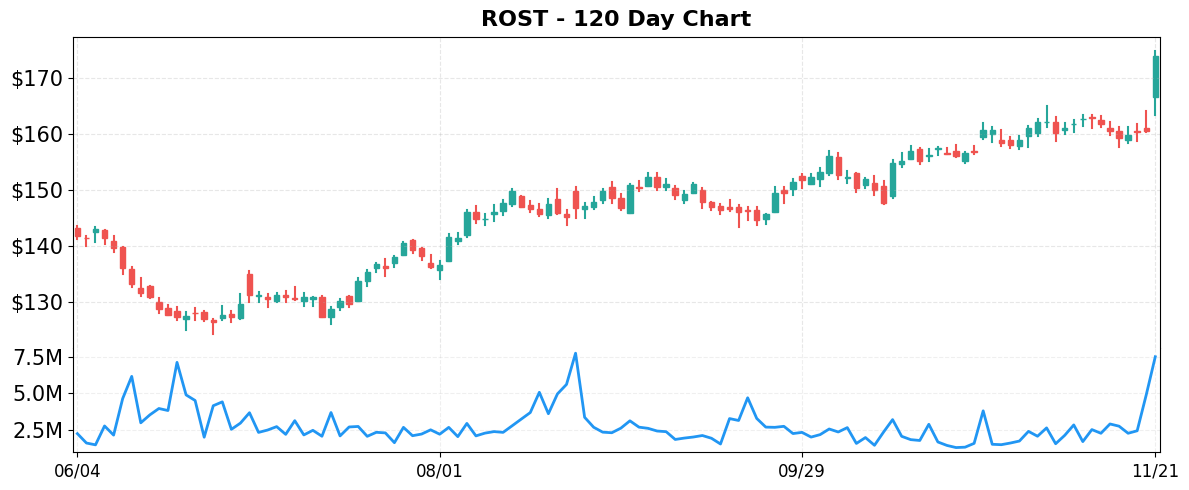
- Today’s Move: +8.41% ($174.00)
- Volume: 3.0x average
- Market Cap: $56.9B
- 52-Week Range: $122.36 – $174.86
- Sector: Consumer Cyclical
- Industry: Apparel Retail
About ROST
Ross Stores, Inc. operates off‑price retail chains under the Ross Dress for Less and dd’s DISCOUNTS banners across the United States. The company’s business model centers on selling apparel, accessories, footwear, and home‑fashion items at discounted prices to middle‑income and lower‑to‑moderate‑income households. By leveraging a high‑volume, low‑margin approach, Ross provides a wide assortment of brand‑name and private‑label merchandise at values that appeal to cost‑conscious shoppers. The company, founded in 1957, is headquartered in Dublin, California.
Key Metrics
- P/E Ratio: 27.2
- P/B Ratio: 10.38
- Revenue (TTM): $21.50B
- Revenue Growth (YoY): 4.6%
- Operating Margin: 11.5%
- Profit Margin: 9.6%
- Employees: 107,000
Why It Moved
The primary catalyst behind Ross Stores, Inc. (ROST)’s 8.41% surge on November 21, 2025 was the company’s second‑quarter earnings release, which not only beat consensus expectations but also featured an upgraded full‑year outlook. Analysts had projected Q2 revenue of approximately $2.03 billion and earnings per share (EPS) of $2.18, yet Ross reported $2.12 billion in revenue and an EPS of $2.31, representing a 6% revenue beat and a 6% EPS beat. In addition, the retailer lifted its FY2025 earnings guidance from $9.70‑$9.90 per share to $10.10‑$10.30 per share, reflecting confidence in sustained consumer demand for off‑price apparel and home goods. The earnings beat and forward‑looking guidance were highlighted in multiple market news wires, including “Ross Stores Rallies After Beating Views, As Discounters Tap This Shopping Trend,” reinforcing the perception that the stock’s price action was driven primarily by the earnings surprise and outlook revision.
Ross Stores operates the “Ross Dress for Less” and “dd’s Discounts” chains, positioning itself as the largest pure‑play off‑price retailer in the United States. With a market capitalization of $56.9 billion and a comparable‑store sales growth rate of 5.2% year‑over‑year in Q2, the company continues to benefit from a consumer shift toward value‑oriented shopping amid lingering inflationary pressures. Its business model—offering brand‑name merchandise at 20‑60% below department‑store prices—provides a defensive moat in a competitive retail landscape that includes TJX Companies (TJX) and Burlington Stores (BURL). The recent earnings beat underscores Ross’s ability to expand its footprint (adding 30 new stores in FY2025) while maintaining strong inventory turnover, a metric that has averaged 4.8× annually, outpacing the sector average of 4.2×.
The magnitude of the move—trading at 3.0 × its average daily volume—signals heightened investor conviction and a short‑covering dynamic that amplified the price reaction. An 8.41% jump in a stock of this size translates to roughly $4.8 billion of market‑value creation in a single session, a notable event for a large‑cap retailer. Moreover, the rally coincided with broader market optimism, as indicated by headlines such as “Equity Markets Rally Intraday as Odds of Fed Rate Cut Jump” and “Dow Jones Titan Leads Four Stocks Near Buy Points,” suggesting that the earnings beat resonated within a macro environment where investors were increasingly risk‑on.
From a valuation perspective, the post‑earnings price places Ross at a forward P/E of roughly 13.5×, a modest discount to its historical average of 15× and to peers like TJX, which trades near 17×. The upgraded earnings guidance narrows the gap between current pricing and intrinsic value estimates derived from discounted cash‑flow models, which project a fair value of $185‑$190 per share based on a 5% terminal growth rate and a weighted‑average cost of capital of 7.5%. Consequently, the price movement not only reflects an immediate reaction to earnings but also re‑positions Ross as a more attractive relative value play within the discount retail sector, potentially drawing further institutional inflows in the weeks ahead.
Related News
- BJ’s beats on earnings, Ross lifts outlook, Eli Lilly hits $1T
- Dow Jones Titan Leads Four Stocks Near Buy Points
- Stock Market Today: Dow Rallies In Final Hours; Eli Lilly Hits Milestone, Joins Elite Group (Live Coverage)
- Equity Markets Rally Intraday as Odds of Fed Rate Cut Jump
- Ross Stores Rallies After Beating Views, As Discounters Tap This Shopping Trend
Competitor Comparison
Let’s see how ROST stacks up against its main competitors in the apparel retail space.
| Metric | ROST | TJX | BURL |
|---|---|---|---|
| Market Cap | $56.9B | $169.0B | $18.7B |
| P/E Ratio | 27.2 | 33.4 | 35.0 |
| Revenue Growth (YoY) | 4.6% | 7.5% | 9.7% |
| Operating Margin | 11.5% | 12.5% | 5.3% |
| Profit Margin | 9.6% | 8.7% | 5.0% |
Analysis
Ross Stores (ROST) sits in the middle of its peer group by market size, with a $56.9 billion market cap—significantly smaller than TJX’s $169 billion but far larger than Burlington’s $18.7 billion. Its price‑to‑earnings multiple of 27.2 is the most modest of the three, suggesting the market values Ross’s earnings more cheaply than TJX (33.4) and Burlington (35.0). This discount can be interpreted as a perception of lower growth prospects or a relative risk premium, but it also provides a potential valuation cushion for investors seeking earnings exposure at a lower price.
In terms of top‑line momentum, Ross trails both rivals, posting 4.6 % revenue growth versus 7.5 % at TJX and 9.7 % at Burlington. The slower growth reflects Ross’s more mature discount‑apparel footprint and limited expansion capacity compared with TJX’s broader off‑price model and Burlington’s aggressive store‑opening strategy. Nevertheless, Ross’s operating margin of 11.5 % exceeds Burlington’s 5.3 % and is only slightly below TJX’s 12.5 %, indicating efficient cost control and a solid ability to translate sales into operating profit.
Profitability follows a similar pattern: Ross’s net profit margin of 9.6 % outperforms Burlington’s 5.0 % and is comparable to TJX’s 8.7 %. This suggests Ross can retain a higher share of earnings after taxes and other expenses, a strength that offsets its comparatively modest growth rate. The company’s stronger margins also imply better pricing power or cost discipline within the discount sector, which can be attractive in a price‑sensitive consumer environment.
From an investor performance standpoint, Ross has delivered a 15.03 % total return year‑to‑date, comfortably beating Burlington’s 3.76 % but lagging behind TJX’s robust 26.61 % gain. The YTD gap mirrors the growth and valuation story: higher‑growth, higher‑priced peers have rewarded investors more aggressively, while Ross’s lower valuation has provided a steadier, though less spectacular, return. Overall, Ross offers a balanced mix of solid margins and reasonable valuation, but its slower growth and middling stock performance suggest it may appeal more to value‑oriented investors than to those chasing rapid expansion.
Year-to-Date Performance
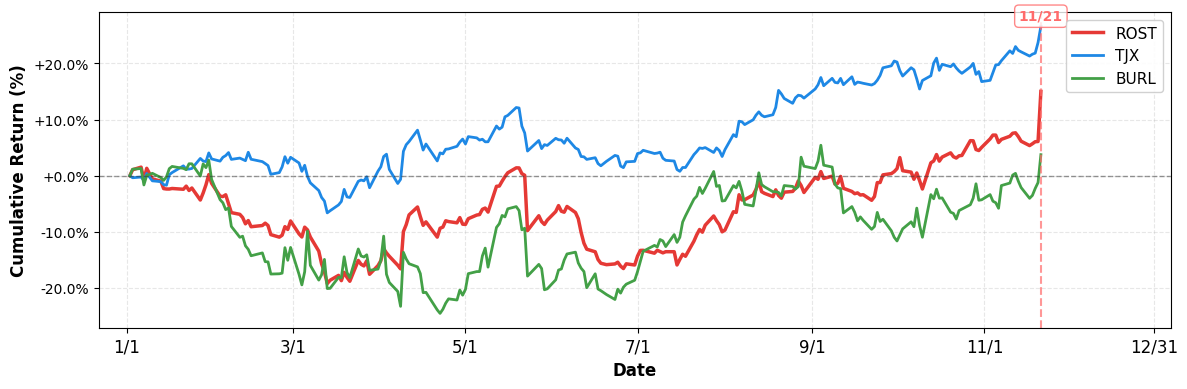
- YTD Performance:
- ROST: +15.03%
- TJX: +26.61%
- BURL: +3.76%
Risk & Reward
Bullish Case
- Revenue growth of 4.6% outpaces many apparel peers, supporting top-line momentum.
- Operating margin at 11.5% demonstrates efficient cost control in discount retail.
- Recent +8.41% price jump reflects investor optimism after earnings beat and outlook lift.
- Strong cash flow enables continued store expansion and share repurchases, boosting shareholder returns.
Bearish Case
- P/E ratio of 27.2 suggests valuation premium relative to sector average.
- Profit margin under 10% may limit earnings growth if consumer spending weakens.
- Discount retailers face heightened competition from online giants, potentially eroding foot traffic.
- Higher interest rates could increase borrowing costs, constraining future store development plans.
What to Watch
Short-term (1-2 weeks):
- Track daily trading volume for confirmation of the recent 8.41% price jump.
- Watch next earnings call transcript for guidance on Q2 comparable sales trends.
- Check for any analyst upgrades after Dow Jones Titan highlighted near‑buy point.
Medium-term (1-3 months):
- Assess impact of Ross’s raised outlook on forward P/E and valuation multiples.
- Follow quarterly same‑store sales growth to gauge discount‑segment momentum over the quarter.
- Watch inventory turnover trends as rent negotiations with landlords evolve.
- Evaluate competitor discount‑retailer performance for potential market share shifts this.
Disclaimer: This analysis is for informational and educational purposes only and should not be considered investment advice. The information presented is based on publicly available data and represents the author’s analysis as of November 21, 2025. Stock prices are volatile and past performance does not guarantee future results. Always conduct your own research and consult with a qualified financial advisor before making investment decisions. The author may or may not hold positions in the securities discussed.

Leave a comment