[ Watch today’s 60-second video summary here: Youtube Shorts ]
[ Daily Top Gainer Analysis: Blog Post ]
📋 Table of Contents
Market Overview
On November 21, 2025 (Friday), U.S. equity markets posted broad gains, driven by strong earnings momentum and a rally in technology stocks. The S&P 500 climbed 0.98% to 6,602.99, while the Dow Jones Industrial Average surged 1.08% to 46,245.41. The Nasdaq Composite added 0.88% to finish at 22,273.08, underscoring continued investor optimism. The rally came as Treasury yields eased slightly, reinforcing risk appetite across asset classes.
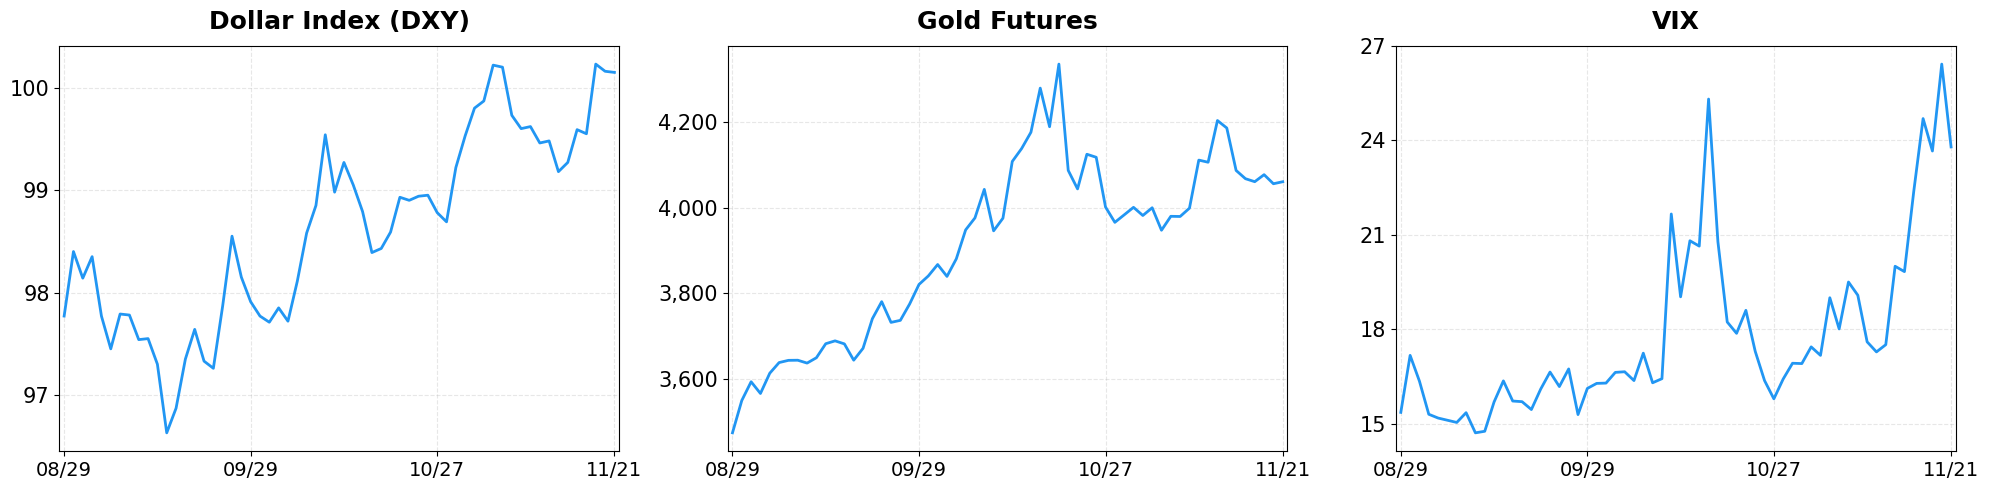
- Dollar Index moved from 100.16 to 100.15 (-0.00%).
- Gold Futures moved from 4056.50 to 4061.60 (+0.13%).
- VIX moved from 26.42 to 23.81 (-9.88%).
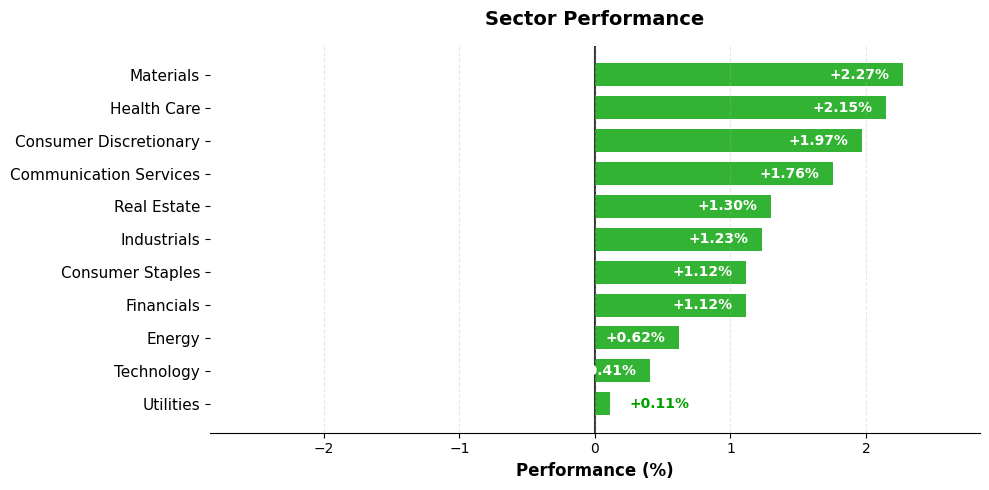
Today’s sector performance shows the following movements:
Market News Highlights
U.S. equity markets showed a brief rebound on Friday, with the Dow, S&P 500, and Nasdaq all posting modest gains after a turbulent week marked by sharp losses. The recovery was driven largely by a surge in rate‑cut speculation, as investors interpreted recent Fed commentary as a possible pivot toward a more accommodative stance. However, the bounce was fragile; underlying volatility remains elevated, reflected in a widening VIX and a stronger U.S. dollar that pressured risk assets across the board.
Strategists note that volatility has “come back with a vengeance,” underscoring the market’s sensitivity to mixed macro signals. The renewed focus on earnings as a de‑facto economic gauge adds another layer of uncertainty, as corporations report results in an environment where traditional data streams are less reliable. Meanwhile, Bitcoin and other cryptocurrencies slipped alongside equities, while the VIX climbed, signaling heightened fear among traders.
Overall, the confluence of renewed rate‑cut bets, persistent volatility, and earnings‑driven market sentiment suggests that the near‑term outlook will be characterized by sharp swings. Investors are likely to remain cautious, balancing the optimism of a potential Fed easing cycle against the reality of a volatile backdrop that could quickly reverse any short‑term gains.
Referenced Articles
- Stock market today: Dow, S&P 500, Nasdaq bounce but end turbulent week with sharp losses
- Volatility is ‘back with a vengeance,’ strategist explains
- Are earnings a new economic indicator for a Fed without data?
- Bitcoin & stocks fall, US dollar & VIX jump: Market takeaways
- US Equity Indexes Rebound as Fed Rate-Cut Bets Almost Double
Index Performance
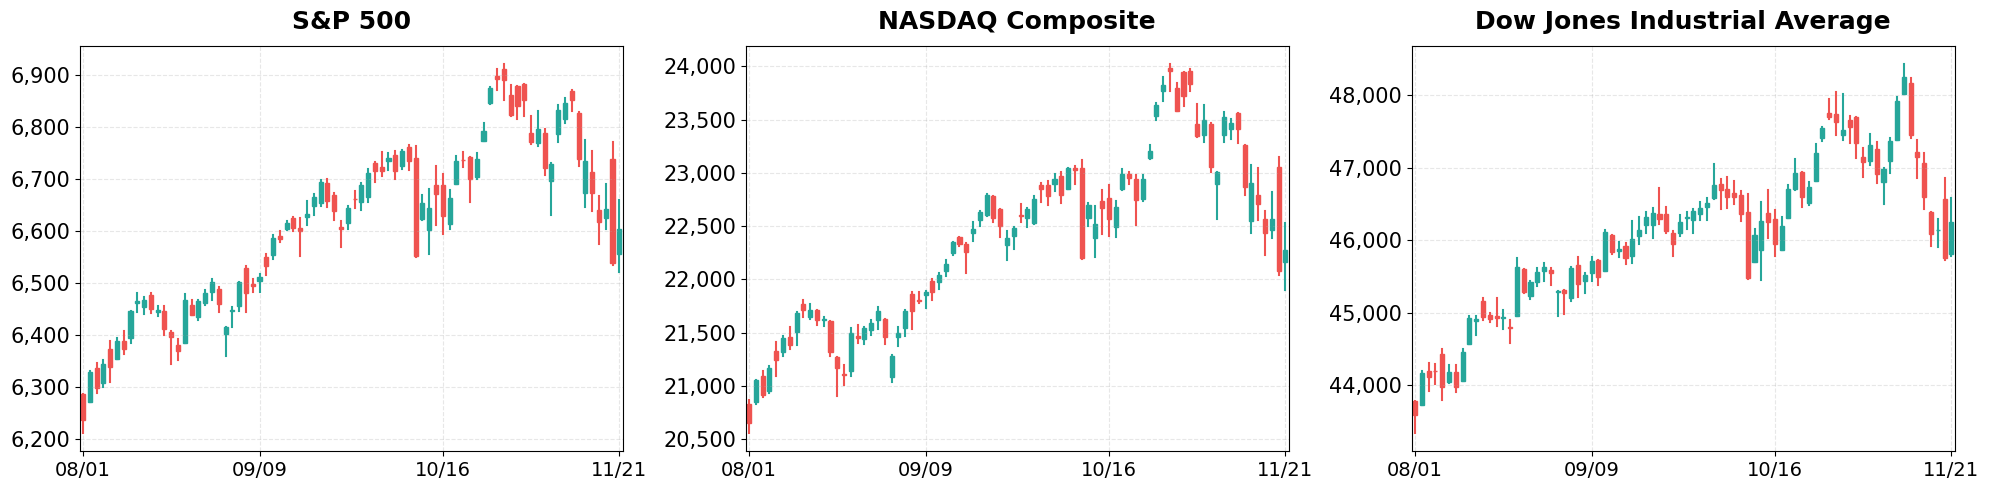
S&P 500 (+0.98%)
The S&P 500’s near‑one‑percent rise reflects renewed confidence in large‑cap earnings, particularly in consumer discretionary and industrials, which led the rally. Volume was above average, suggesting durable buying pressure. Analysts note that the sector rotation toward cyclical stocks may keep momentum alive if economic data remain supportive.
NASDAQ Composite (+0.88%)
The Nasdaq’s 0.88% gain was anchored by solid performance in semiconductor and cloud‑computing names, offsetting modest weakness in biotech. The breadth of advances points to sustained sectoral strength. With the Fed signaling a pause in rate hikes, growth‑oriented tech stocks are likely to stay in favor.
Dow Jones Industrial Average (+1.08%)
The Dow’s 1.08% jump was powered by gains in industrial conglomerates and financials, with the energy sector also contributing after oil prices steadied. Broad participation indicates a healthy market breadth. The index’s dividend‑rich composition continues to attract income‑focused investors amid a stable rate environment.
Top Movers
Top Gainers
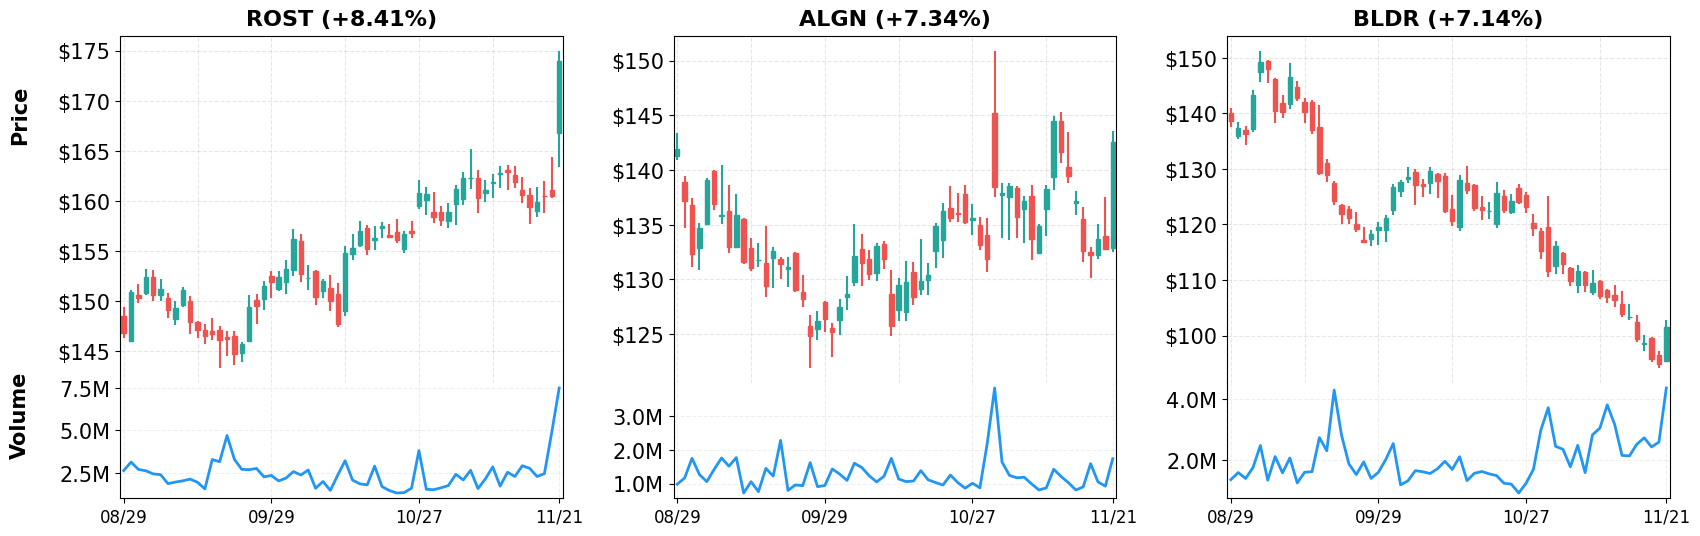
- ROST (+8.41%)
- ALGN (+7.34%)
- BLDR (+7.14%)
Top Losers
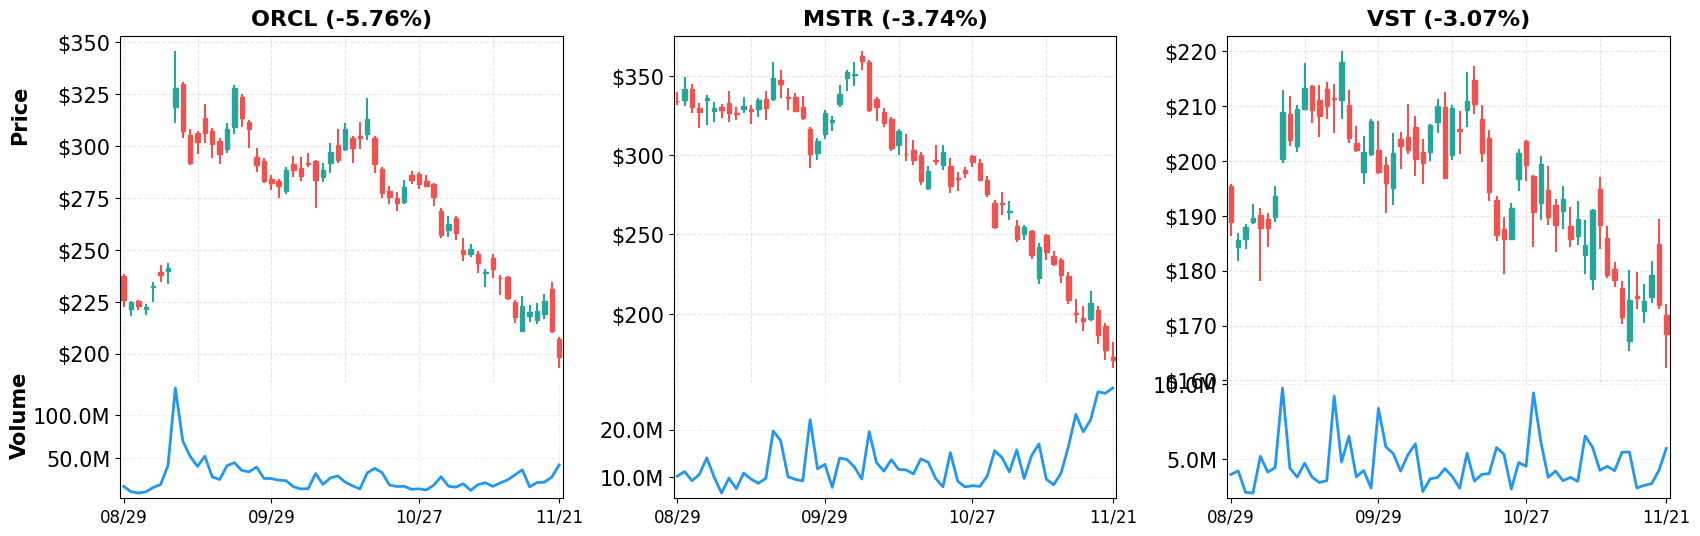
- ORCL (-5.76%)
- MSTR (-3.74%)
- VST (-3.07%)
Magnificent 7
Overview
Performance Comparison: Magnificent 7 vs Major Indices
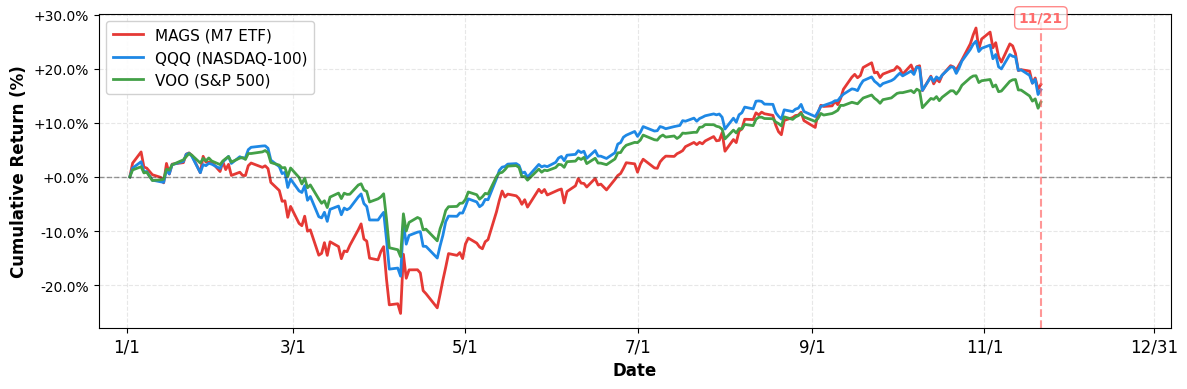
- YTD Performance:
- S&P 500 (VOO): +13.80%
- NASDAQ-100 (QQQ): +16.08%
- Magnificent 7 (MAGS): +17.08%
M7 Total Market Capitalization
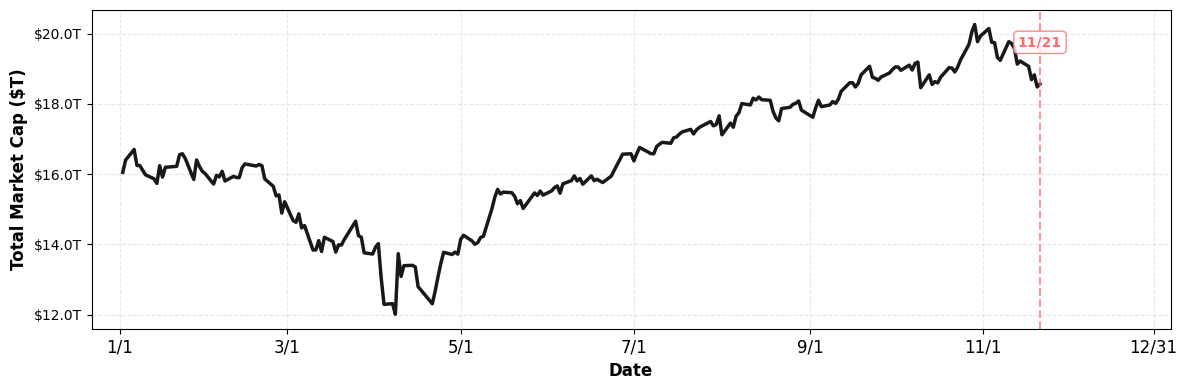
- YTD Market Cap Change:
- $16.05T (1/1) → $18.57T (current), +15.70%
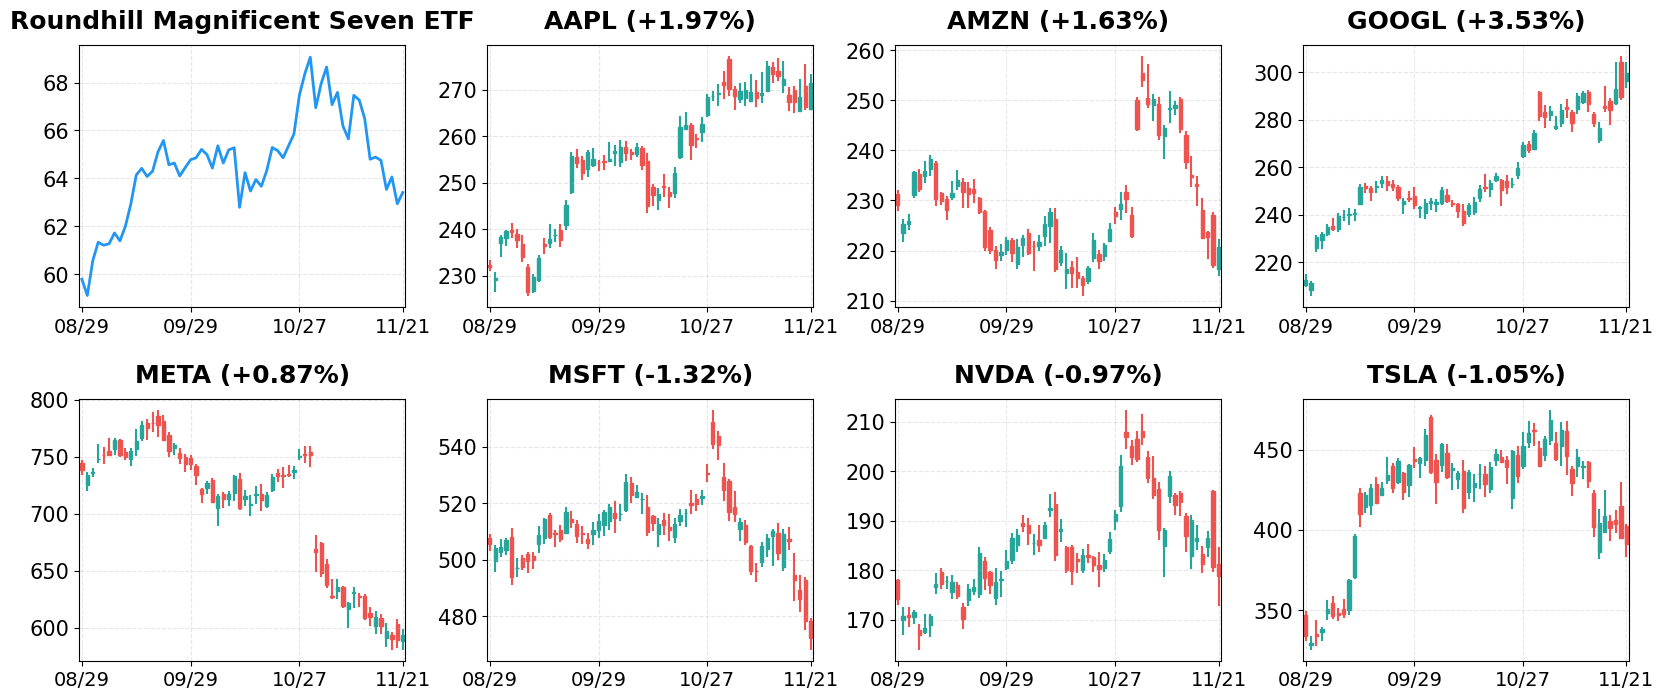
1. AAPL
Price: $271.49 (+1.97%)
- Jim Cramer Insists Apple (AAPL) Hasn’t Missed AI
- Apple, IBD Stock Of The Day, Sets Up Before Holiday Season
- Eli Lilly Becomes First Pharma To Join $1 Trillion Club Alongside Nvidia, Apple, Others
2. AMZN
Price: $220.69 (+1.63%)
- Tesla sued over 2023 crash, Amazon layoffs impact engineers
- Jim Cramer Isn’t Worried by Analyst Downgrading Amazon.com (AMZN)
- This Is the Clearest Indication Amazon Is Going to Be the Next Decade’s Big AI Winner
3. GOOGL
Price: $299.66 (+3.53%)
- I Liked Alphabet (GOOGL) CEO’s Skepticism, Says Jim Cramer
- Alphabet Hits Record High as AI Momentum Builds and $2B Data Center Announced
- Why Shares in Alphabet Bucked The Trend Today
4. META
Price: $594.25 (+0.87%)
- Meta Platforms’ Hidden AI Flywheel Is About to Crush the Competition
- Jim Cramer Continues To Defend Meta Platforms (META)’s AI Spending
- Meta Platforms Just Lost Its Chief AI Scientist. Does That Make META Stock a Sell Here?
5. MSFT
Price: $472.12 (-1.32%)
- Nvidia, Palantir, Microsoft, Tesla Remain Hot Picks Amid AI Sell-Off
- Alphabet Overtakes Microsoft in Stunning Trillion Dollar Market-Cap Upset
- C3.ai Expands Microsoft Cloud Integrations to Boost Enterprise AI
6. NVDA
Price: $178.88 (-0.97%)
- Trump considers allowing Nvidia to sell H200 chips to China: BBG
- Why markets are falling despite Nvidia earnings beat
- Nvidia and this AI ‘dark horse’ are having a ‘breakthrough’
7. TSLA
Price: $391.09 (-1.05%)
- Tesla stock drops to end the week as robotaxi optimism battles AI bubble jitters
- Tesla sued over 2023 crash, Amazon layoffs impact engineers
- Tesla Price Target Reaffirmed at $500 by Piper Sandler After Fremont Visit
Disclaimer: This market briefing is for informational and educational purposes only and should not be considered investment advice. The information presented is based on publicly available data and represents the author’s analysis as of November 21, 2025. Stock prices are volatile and past performance does not guarantee future results. Always conduct your own research and consult with a qualified financial advisor before making investment decisions. The author may or may not hold positions in the securities discussed.

Leave a comment