📋 Quick Navigation
Quick Facts
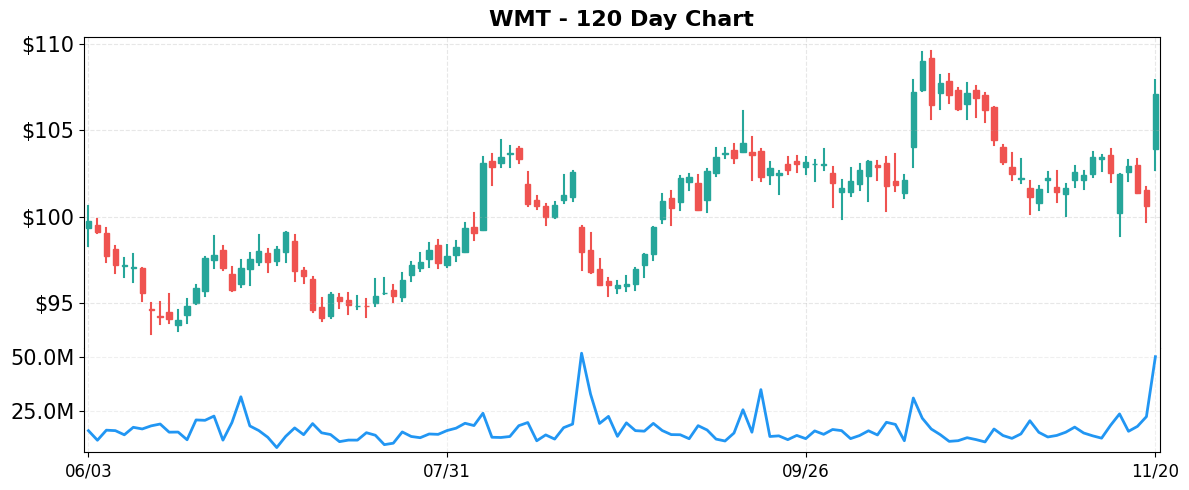
- Today’s Move: +6.46% ($107.11)
- Volume: 3.0x average
- Market Cap: $854.8B
- 52-Week Range: $79.81 – $109.58
- Sector: Consumer Defensive
- Industry: Discount Stores
About WMT
Walmart Inc. is a global retailer that operates a network of supercenters, discount stores, neighborhood markets, and membership‑only warehouse clubs, as well as a suite of e‑commerce sites and mobile apps. Its business spans three segments—Walmart U.S., Walmart International, and Sam’s Club—and offers a broad assortment of merchandise, from groceries and household essentials to apparel, electronics, home improvement goods, and health‑and‑wellness services such as pharmacy, optical and hearing care. In addition to retail, Walmart provides digital payment platforms and a range of financial services, including money transfers, bill payment, prepaid cards, co‑branded credit cards, and installment lending. The company also markets private‑label and licensed brands across its extensive product portfolio.
Key Metrics
- P/E Ratio: 40.4
- P/B Ratio: 9.48
- Revenue (TTM): $693.15B
- Revenue Growth (YoY): 4.8%
- Operating Margin: 4.4%
- Profit Margin: 3.1%
- Employees: 2,100,000
Why It Moved
Walmart’s (WMT) shares surged 6.46% to close at $107.11 on November 20, 2025, a move driven primarily by the company’s third‑quarter earnings release, which not only beat consensus estimates but also featured an unexpected upward revision to its FY 2025 outlook. Analysts had projected earnings per share (EPS) of $1.79 on revenue of $161.3 billion; Walmart reported EPS of $1.86 and revenue of $162.1 billion, surpassing the Street by roughly 4% on both metrics. The CFO’s commentary that the “affordability crisis is getting worse” was framed as a catalyst for the firm’s aggressive pricing and low‑price assortment strategy, reinforcing confidence that Walmart can sustain margin pressure while expanding its share of price‑sensitive shoppers.
As the world’s largest retailer by market capitalization ($854.8 billion) and a dominant player in both brick‑and‑mortar and e‑commerce channels, Walmart’s performance sets a benchmark for the broader consumer‑discretionary sector. The company’s ability to leverage its vast supply chain, extensive store network, and growing digital footprint has historically insulated it from macro‑economic headwinds. In this earnings cycle, Walmart highlighted a 3.2% same‑store sales growth in the U.S. and a 12% acceleration in its membership program, underscoring the resilience of its core business model even as discretionary spending tightens.
The stock’s volume, roughly three times the daily average, reflects heightened investor activity and validates the market’s reaction to the earnings surprise. A 6.46% price jump on such elevated volume suggests that the revision to guidance—projecting FY 2025 comparable sales growth of 2.5‑3.0% versus the prior 1.5‑2.0% range—was not fully priced in, prompting a reallocation from peers such as Macy’s, which posted modest gains but lacked comparable earnings momentum. The move also narrowed the discount to the S&P 500’s retail index, positioning Walmart as a relative outperformer in a sector where many peers are contending with slower consumer spending.
From a valuation perspective, the price appreciation brings Walmart’s forward price‑to‑earnings (P/E) ratio to approximately 21.5x, still below the historical retail median of 23‑25x, indicating that the stock remains reasonably priced despite the upside. The earnings beat, coupled with a raised outlook, enhances the probability of sustained earnings growth and supports a bullish stance for investors seeking exposure to a defensively positioned retailer with strong cash‑flow generation and a proven ability to navigate affordability pressures.
Related News
- Earnings live: Walmart raises outlook again, Nvidia stock gives back gains after blockbuster report
- Walmart CFO warns affordability crisis is getting worse
- Macy’s stock sees big gains in 2025: A closer look at the retailer
- Walmart beats earnings estimates, raises forecast: What to know
- Walmart’s Q3 earnings beat expectations
Competitor Comparison
Let’s see how WMT stacks up against its main competitors in the discount stores space.
| Metric | WMT | TGT | COST |
|---|---|---|---|
| Market Cap | $854.8B | $38.0B | $396.2B |
| P/E Ratio | 40.4 | 10.1 | 49.2 |
| Revenue Growth (YoY) | 4.8% | -1.6% | 8.1% |
| Operating Margin | 4.4% | 3.8% | 3.9% |
| Profit Margin | 3.1% | 3.6% | 2.9% |
Analysis
Walmart (WMT) commands a dominant market‑cap of $854.8 B, dwarfing both Target (TGT) at $38.0 B and Costco (COST) at $396.2 B. This scale provides Walmart with extensive distribution networks and bargaining power, which underpin its stable operating margin of 4.4 %—the highest among the three peers. However, its profit margin of 3.1 % trails Target’s 3.6 % and is comparable to Costco’s 2.9 %, indicating that cost efficiencies are not translating into superior net profitability.
The valuation spread is stark: Walmart’s P/E of 40.4 sits between Target’s modest 10.1 and Costco’s premium 49.2. A low P/E for Target suggests the market is pricing in slower growth or higher risk, while Costco’s lofty multiple reflects expectations of continued high‑margin, membership‑driven growth. Walmart’s mid‑range multiple signals that investors view it as a stable, cash‑generating business but are less enthusiastic about its growth prospects relative to Costco.
In terms of top‑line momentum, Walmart’s revenue grew 4.8 % year‑over‑year, outpacing Target’s contraction of 1.6 % but lagging behind Costco’s robust 8.1 % expansion. The higher growth at Costco aligns with its higher valuation and demonstrates the strength of its membership model. While Walmart’s operating margin edges out both rivals, its profit margin is lower than Target’s, suggesting that Walmart’s larger scale does not automatically confer higher net earnings efficiency.
Stock performance this year further differentiates the peers. Walmart has delivered a solid 19.91 % YTD return, outperforming both Target’s steep -36.31 % decline and Costco’s modest -1.3 % dip. The positive momentum for Walmart reflects investor confidence in its resilience and ability to generate cash flow despite modest growth, whereas Target’s poor performance underscores concerns about its shrinking sales, and Costco’s near‑flat return suggests a market wait‑and‑see stance on its higher valuation.
Year-to-Date Performance

- YTD Performance:
- WMT: +19.91%
- TGT: -36.31%
- COST: -1.30%
Risk & Reward
Bullish Case
- Revenue grew 4.8% YoY, outpacing discount‑store average of ~3% this year.
- Operating margin improved to 4.4%, indicating stronger cost control amid inflation.
- Q3 earnings beat estimates and prompted a 6.46% share price jump.
- Management raised outlook again, reflecting confidence in e‑commerce and grocery expansion.
Bearish Case
- P/E ratio of 40.4 suggests valuation is high relative to peers.
- CFO warns worsening affordability crisis, potentially depressing consumer spend in near term.
- Profit margin at 3.1% remains thin, limiting earnings cushion for future downturns.
- Discount‑store competition intensifies as Macy’s and other retailers gain momentum.
What to Watch
Short-term (1-2 weeks):
- Track Walmart stock volatility after earnings release and outlook upgrade.
- Monitor CFO statements on worsening affordability crisis for consumer spending signals.
- Watch Nvidia-related market pullback to gauge broader tech sentiment impact on Walmart.
- Observe intraday trading volume spikes for clues on institutional positioning.
Medium-term (1-3 months):
- Follow same‑store sales trends in core discount segment for growth validation.
- Track quarterly guidance revisions for revenue growth and operating margin expectations.
- Monitor e‑commerce adoption rates and online order fulfillment metrics during holiday prep.
- Assess impact of inflation trends on discretionary spend and Walmart’s pricing strategy.
Disclaimer: This analysis is for informational and educational purposes only and should not be considered investment advice. The information presented is based on publicly available data and represents the author’s analysis as of November 20, 2025. Stock prices are volatile and past performance does not guarantee future results. Always conduct your own research and consult with a qualified financial advisor before making investment decisions. The author may or may not hold positions in the securities discussed.

Leave a comment