[Watch today’s 60-second video summary here: (Feature coming soon)]
📋 Table of Contents
Market Overview
On November 20, 2025, U.S. equity markets opened lower amid heightened inflation concerns and a weaker earnings outlook. The S&P 500 slipped 1.56% to 6,538.76, the Nasdaq Composite fell 2.15% to 22,078.05, and the Dow Jones Industrial Average dropped 0.84% to 45,752.26. Higher‑than‑expected Treasury yields pressured valuation multiples, while a stronger dollar added headwinds for exporters. International markets mirrored the U.S. trend, with European indices also posting declines. Investor sentiment indices moved into risk‑averse territory, underscoring the cautious tone across asset classes.
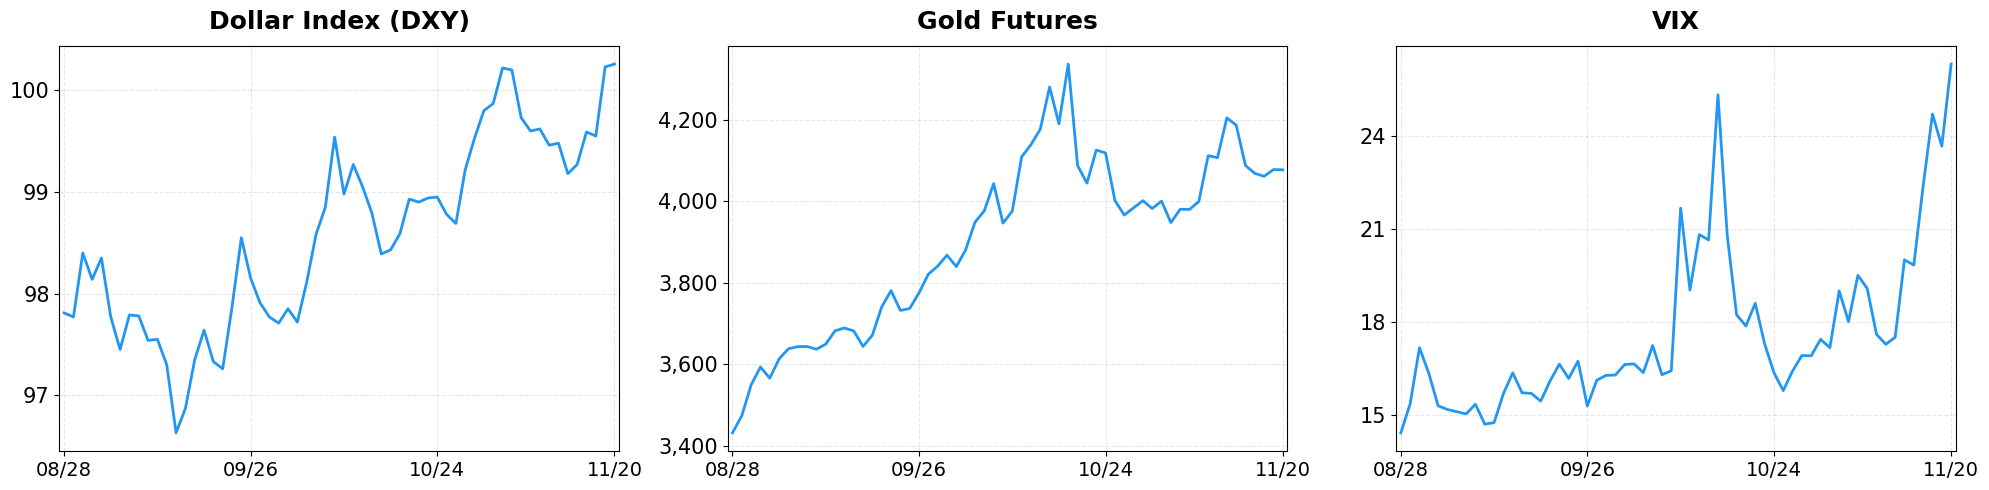
- Dollar Index moved from 100.23 to 100.26 (+0.03%).
- Gold Futures moved from 4077.70 to 4076.90 (-0.02%).
- VIX moved from 23.66 to 26.30 (+11.16%).
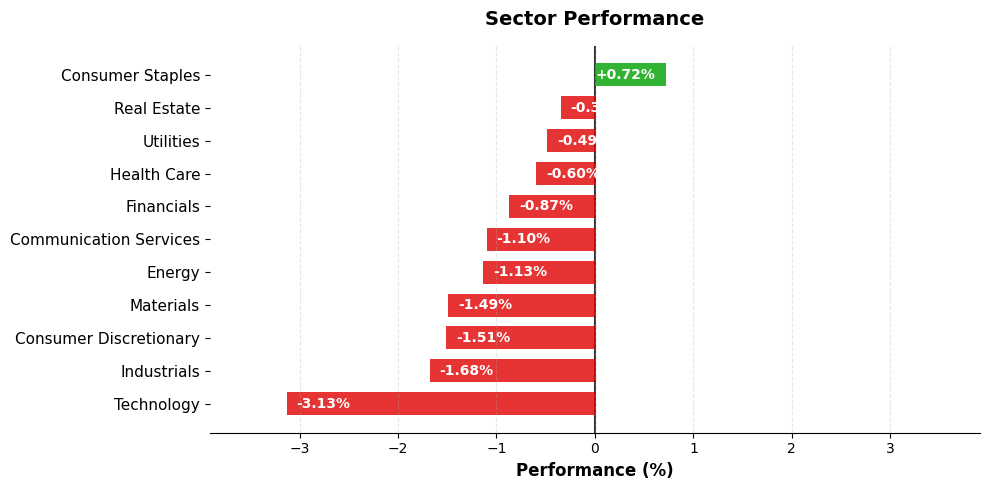
Today’s sector performance shows the following movements:
Market News Highlights
The broad market opened with a reversal of earlier gains as both the Dow Jones Industrial Average and the S&P 500 slipped, while the Nasdaq Composite fell sharply after a brief rally driven by Nvidia. The chip‑maker’s profit‑taking and a pullback in other technology stocks sparked a sector‑wide rotation toward more defensive names. Bitcoin also retreated, adding to the risk‑off sentiment that weighed on equity valuations. The combined effect was a modest decline across the major indices, underscoring the market’s sensitivity to momentum shifts in high‑growth tech assets.
In contrast, earnings and macro‑economic data provided pockets of optimism. Walmart reported third‑quarter results that topped expectations, with sales beating forecasts and the retailer raising its full‑year outlook. The upbeat performance reinforced confidence in consumer spending resilience despite higher interest rates. Meanwhile, a strategist projected that U.S. economic growth in 2026 will exceed current estimates, suggesting a longer‑term expansionary trend that could support equity valuations. Cracker Barrel’s shareholders voted to retain the current CEO, and existing‑home sales showed a modest rise, indicating stability in both the restaurant sector and the housing market.
Overall, the market narrative today reflects a tug‑of‑war between short‑term tech profit‑taking and longer‑term fundamentals driven by consumer spending strength and a favorable growth outlook. Investors are likely to favor companies with solid earnings momentum and defensive positioning while monitoring further developments in the technology sector and broader macro‑economic indicators.
Referenced Articles
- Stock market today: Dow, S&P 500, Nasdaq slide out gains as Nvidia, tech stocks lead sharp reversal lower
- Cracker Barrel votes to keep on CEO, US existing home sales rise
- US economic growth in 2026 will beat estimates, strategist says
- Nasdaq Composite falls as Nvidia gives up gains, bitcoin slides
- Walmart stock rises after Q3 earnings, sales top expectations as company raises full-year forecasts
Index Performance
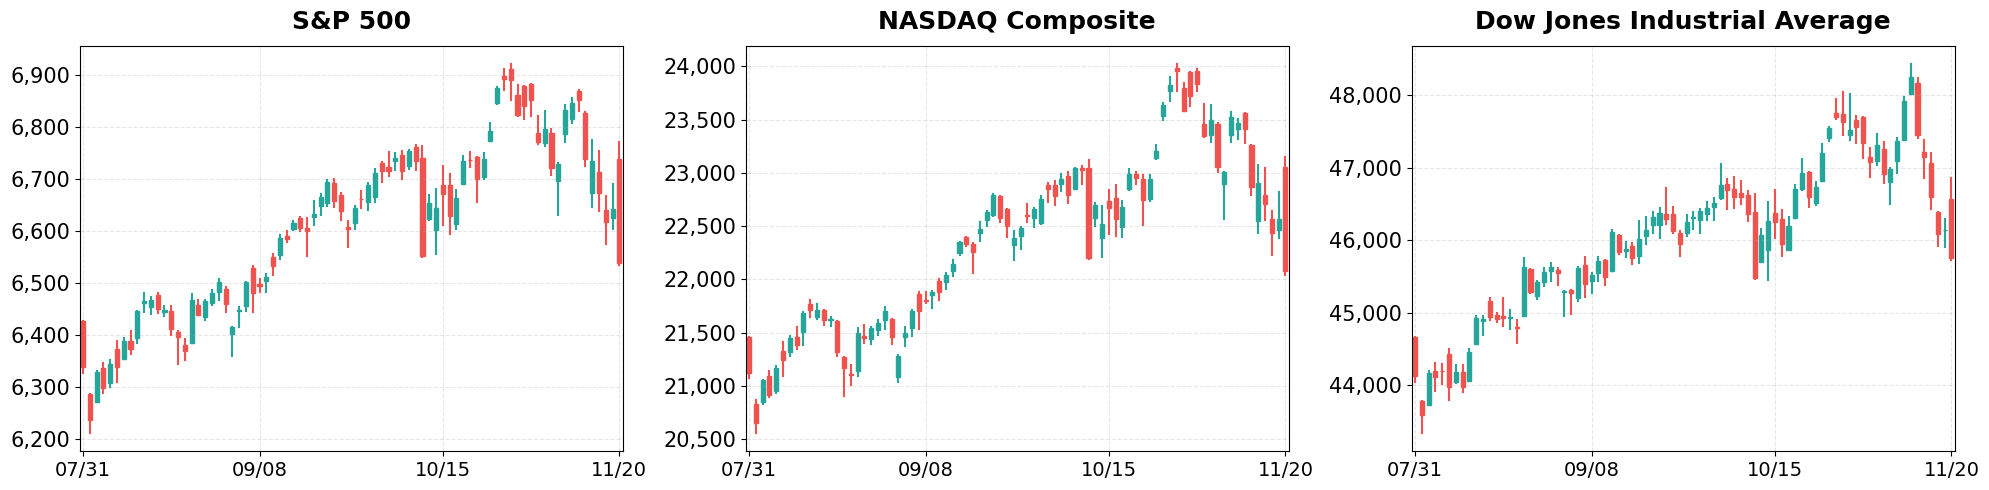
S&P 500 (-1.56%)
The S&P 500’s decline reflects pressure on large‑cap sectors, especially consumer discretionary and industrials, which underperformed after earnings misses. Volume was moderate, indicating that the sell‑off may be driven more by sentiment than by liquidity constraints.
NASDAQ Composite (-2.15%)
Technology and growth‑oriented names led the Nasdaq’s slide, with mega‑caps such as Apple and Nvidia retreating after disappointing revenue guidance. The broader tech correction amplified the index’s weakness, pulling the composite deeper into red.
Dow Jones Industrial Average (-0.84%)
The Dow’s modest dip was anchored by defensive staples, yet lagged as energy and financials fell amid rising bond yields. The mixed performance suggests sector rotation rather than a systemic sell‑off.
Top Movers
Top Gainers
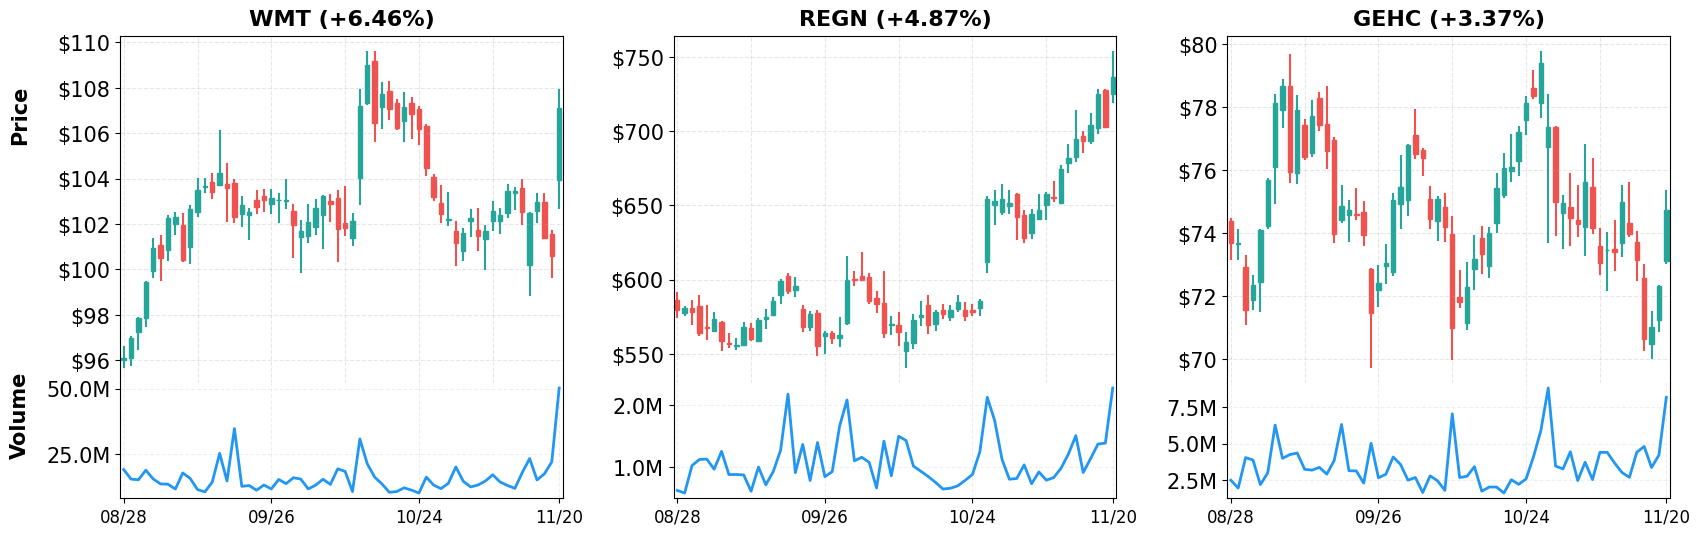
- WMT (+6.46%)
- REGN (+4.87%)
- GEHC (+3.37%)
- Morgan Stanley Lifted GE HealthCare Target to $80 in Late October, Citing Strong Orders and Backlog
- FDA Approves First Generic Omnipaque: Might Change The Case For Investing In Amneal Pharmaceuticals (AMRX)
- GE HealthCare Technologies (GEHC): Assessing Valuation Following Recent Share Price Movements
Top Losers
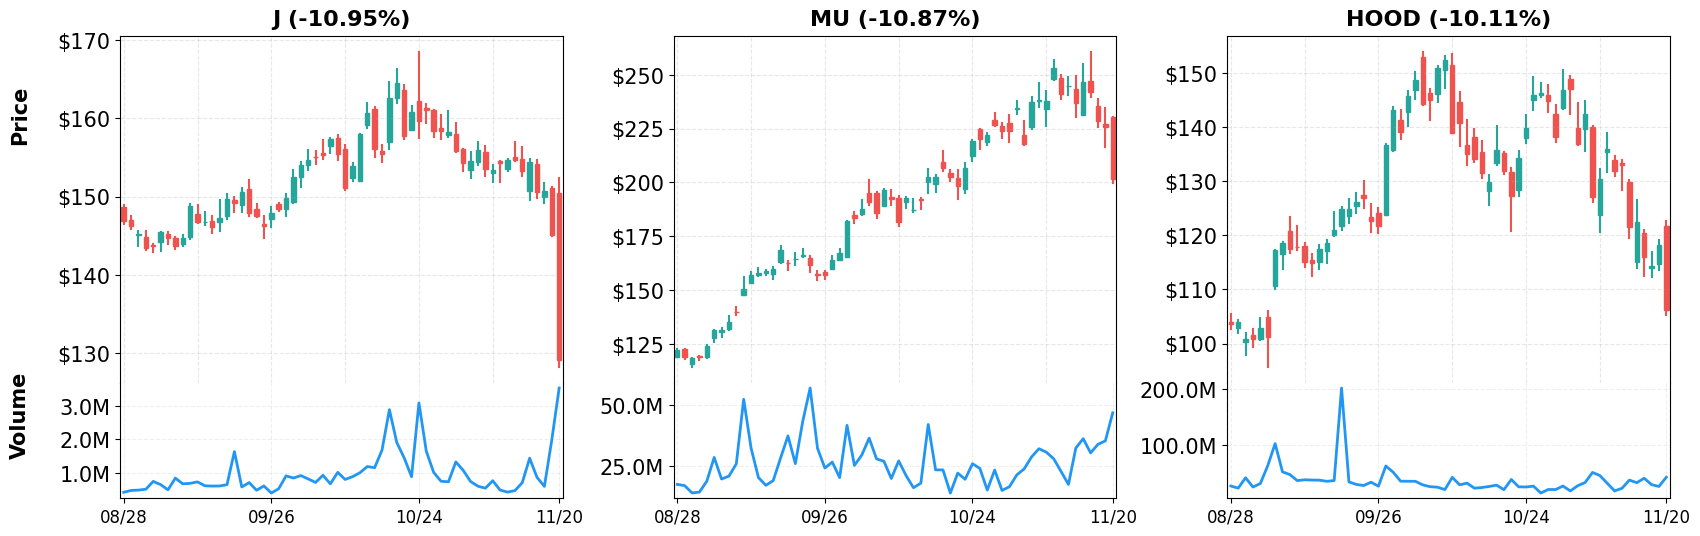
- J (-10.95%)
- MU (-10.87%)
- HOOD (-10.11%)
Magnificent 7
Overview
Performance Comparison: Magnificent 7 vs Major Indices
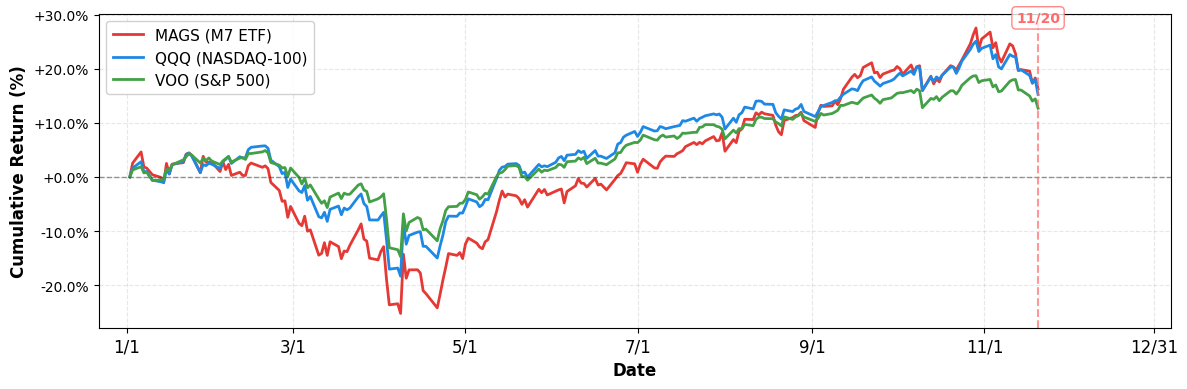
- YTD Performance:
- S&P 500 (VOO): +12.68%
- NASDAQ-100 (QQQ): +15.22%
- Magnificent 7 (MAGS): +16.27%
M7 Total Market Capitalization
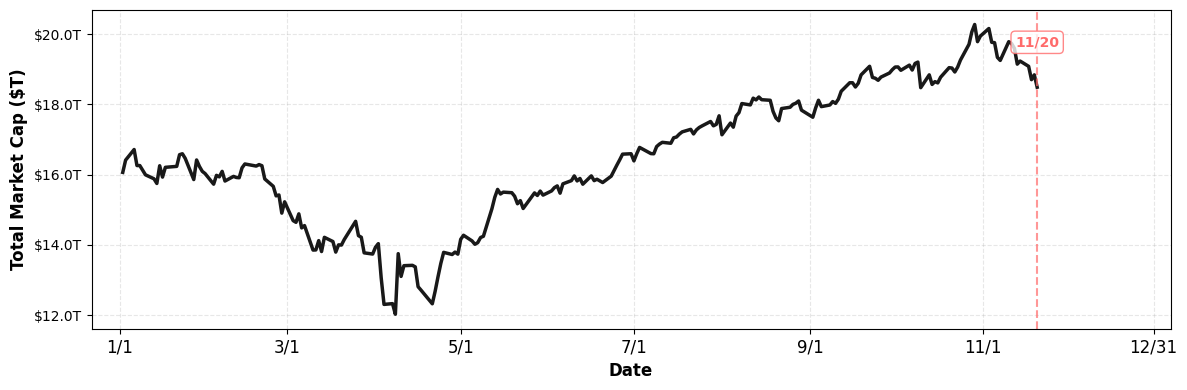
- YTD Market Cap Change:
- $16.06T (1/1) → $18.49T (current), +15.13%
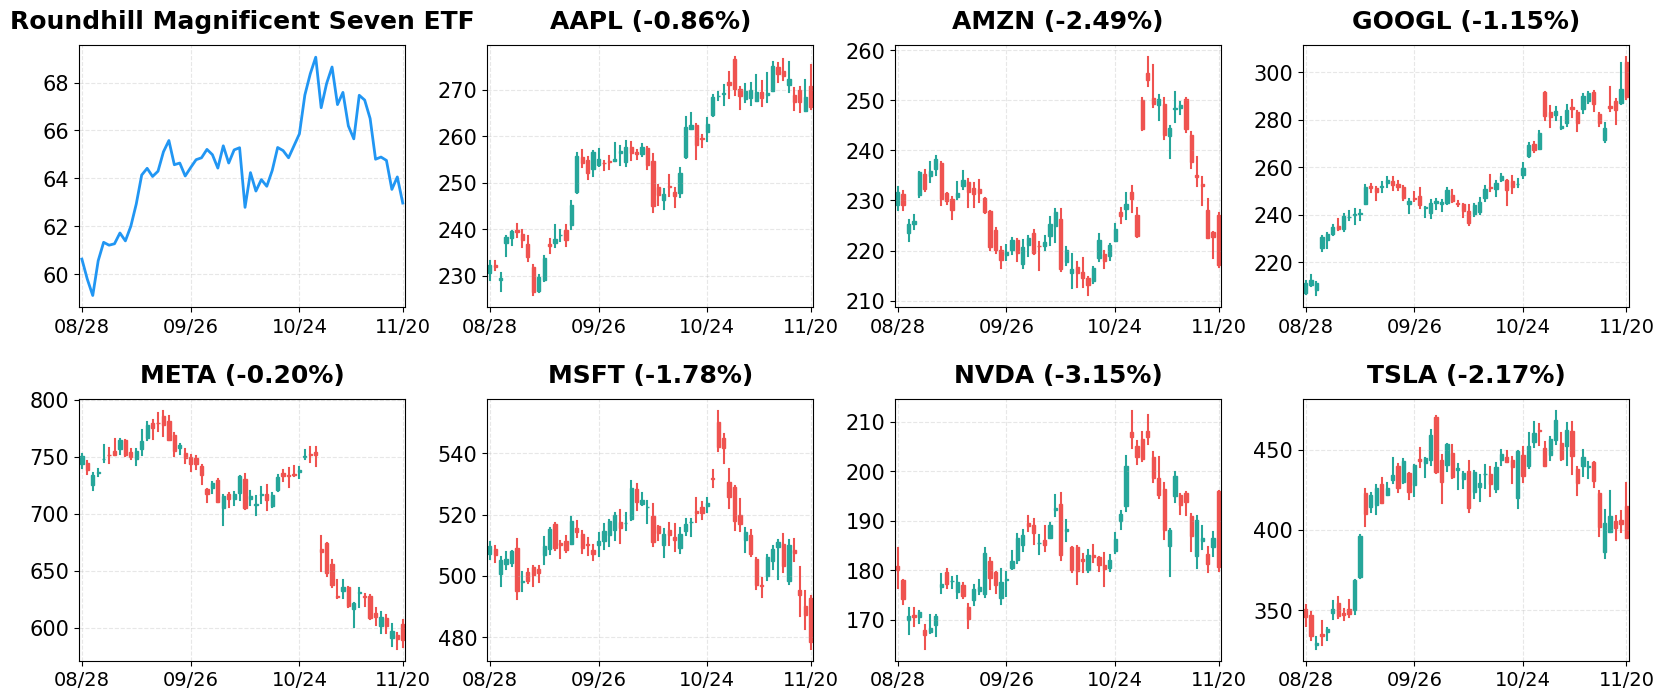
1. AAPL
Price: $266.25 (-0.86%)
- Warren Buffett Is Selling Apple and Piling Into This “Magnificent Seven” Stock Trading at a Fraction of Tesla’s Valuation
- Here’s How Apple (AAPL) Impacted Baron Opportunity Fund’s Performance
- Warren Buffett Sells 74% of Apple Stake, Invests Billions in Alphabet
2. AMZN
Price: $217.14 (-2.49%)
- Is the ‘no-hire, no-fire’ labor market narrative breaking as job cuts mount?
- Stock market today: Dow, S&P 500, Nasdaq rise as stocks pause sell-off streak before Nvidia earnings
- What Nvidia Earnings Mean For Tesla As 2026 Could Be The Year Of The Robotaxi Wars
3. GOOGL
Price: $289.45 (-1.15%)
- Palo Alto Networks slips despite Q1 beat, ByteDance valuation soars
- First it was GPUs and electricity, now AI is eating up the memory industry
- What Nvidia Earnings Mean For Tesla As 2026 Could Be The Year Of The Robotaxi Wars
4. META
Price: $589.15 (-0.20%)
- Meta Hit With $552 Million Fine In Spain Over Ad Practices
- Magnificent Seven Stocks: Nvidia Sells Off On Earnings; Amazon, Meta, Microsoft Slide
- EXCLUSIVE: ‘We Dropped Out Of Harvard And Dedicated Our Lives To Building This’—Their $479 AI With ‘Hyper-Intelligent’ Brain Rivals Meta [UPDATED]
5. MSFT
Price: $478.43 (-1.78%)
- Magnificent Seven Stocks: Nvidia Sells Off On Earnings; Amazon, Meta, Microsoft Slide
- Nvidia CEO hits back at AI bubble, circular investing fears: ‘We see something very different’
- The ‘loopification’ of AI is making me dizzy
6. NVDA
Price: $180.64 (-3.15%)
- Earnings live: Walmart raises outlook again, Nvidia stock gives back gains after blockbuster report
- Nvidia: Why this analyst is ‘as confident about 2026 as ever’
- Nvidia earnings offer ‘reprieve’ to sell-off. But can it last?
7. TSLA
Price: $395.23 (-2.17%)
- What Nvidia Earnings Mean For Tesla As 2026 Could Be The Year Of The Robotaxi Wars
- Warren Buffett Is Selling Apple and Piling Into This “Magnificent Seven” Stock Trading at a Fraction of Tesla’s Valuation
- Tesla gets eye-popping message from latest survey
Disclaimer: This market briefing is for informational and educational purposes only and should not be considered investment advice. The information presented is based on publicly available data and represents the author’s analysis as of November 20, 2025. Stock prices are volatile and past performance does not guarantee future results. Always conduct your own research and consult with a qualified financial advisor before making investment decisions. The author may or may not hold positions in the securities discussed.

Leave a comment