[Watch today’s 60-second video summary here: Youtube Shorts ]
📋 Table of Contents
Market Overview
U.S. equities posted modest gains on November 19, 2025, as investors digested mixed earnings and a steady macro backdrop. The S&P 500 climbed to 6,642.16, the NASDAQ rose to 22,564.23, and the Dow Jones edged higher to 46,138.77. Broad‑based optimism in technology and consumer discretionary sectors helped offset lingering concerns over inflation data.
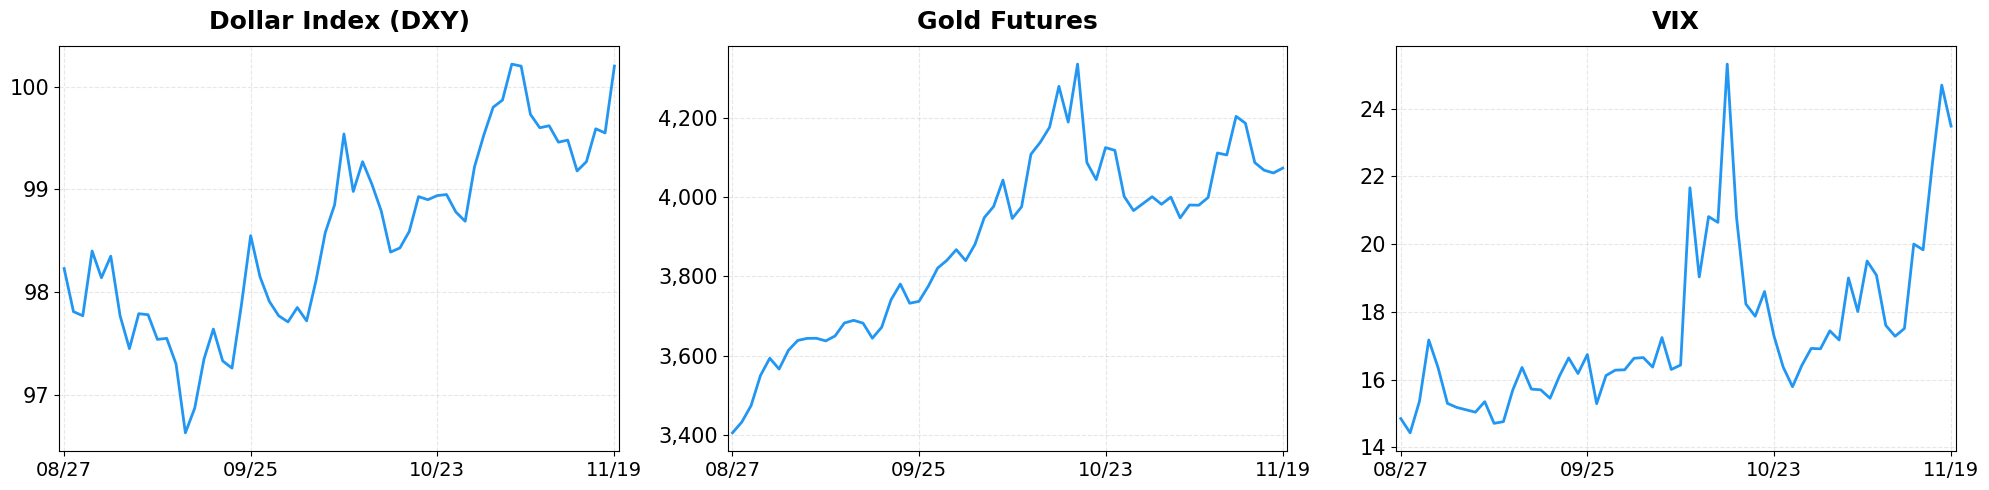
- Dollar Index moved from 99.55 to 100.20 (+0.65%).
- Gold Futures moved from 4061.30 to 4073.80 (+0.31%).
- VIX moved from 24.69 to 23.48 (-4.90%).
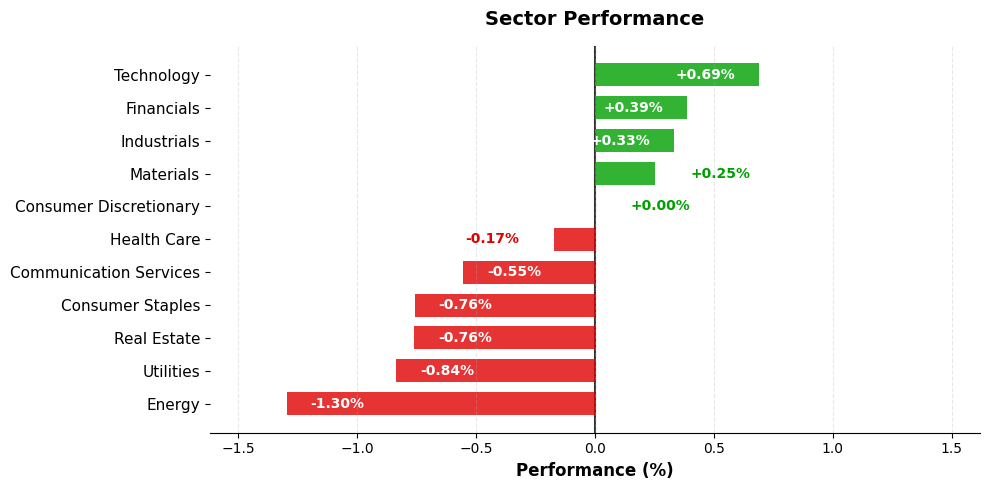
Today’s sector performance shows the following movements:
Market News Highlights
On November 19, 2025, U.S. equity markets displayed a tentative recovery after a brief pause in the recent sell‑off, with the Dow Jones Industrial Average, S&P 500, and Nasdaq Composite all posting modest gains. The rally was largely driven by investors positioning ahead of Nvidia’s upcoming earnings release, a catalyst that has dominated headlines this week. The anticipation of Nvidia’s results helped lift technology‑heavy indexes, while the broader market benefited from a more optimistic tone in the Federal Reserve’s minutes, which suggested a cautious but steady approach to monetary policy.
Contrasting reports emerged from earlier in the session, showing the Dow sliding roughly 500 points and the S&P 500 extending a four‑day losing streak as the earnings clock ticked down. This intra‑day volatility underscores the market’s sensitivity to Nvidia’s performance expectations and the lingering uncertainty surrounding the Fed’s policy trajectory. Analysts note that the recent November weakness may set the stage for a stronger December, as seasonal trends and potential earnings surprises could reinvigorate buying momentum.
Overall, the mixed signals have created a nuanced backdrop: short‑term caution tied to Nvidia’s earnings and Fed commentary, but a longer‑term bullish outlook anchored in the possibility of a year‑end rally. Market participants appear poised to react sharply to the earnings report, which could either validate the current optimism or reignite the sell‑off that has characterized much of the past month.
Referenced Articles
- Stock market today: Dow, S&P 500, Nasdaq rise as stocks pause sell-off streak before Nvidia earnings
- Why November stock weakness could signal a strong December
- Stock market today: Dow slides 500 points, S&P 500 notches 4th day of losses as Nvidia earnings loom
- US Equity Indexes Rise as Investors Await Nvidia’s Results While Weighing Fed’s Latest Meeting Minutes
- Stock Market Today: Dow Gains After Fed Minutes; Nvidia Earnings Next (Live Coverage)
Index Performance
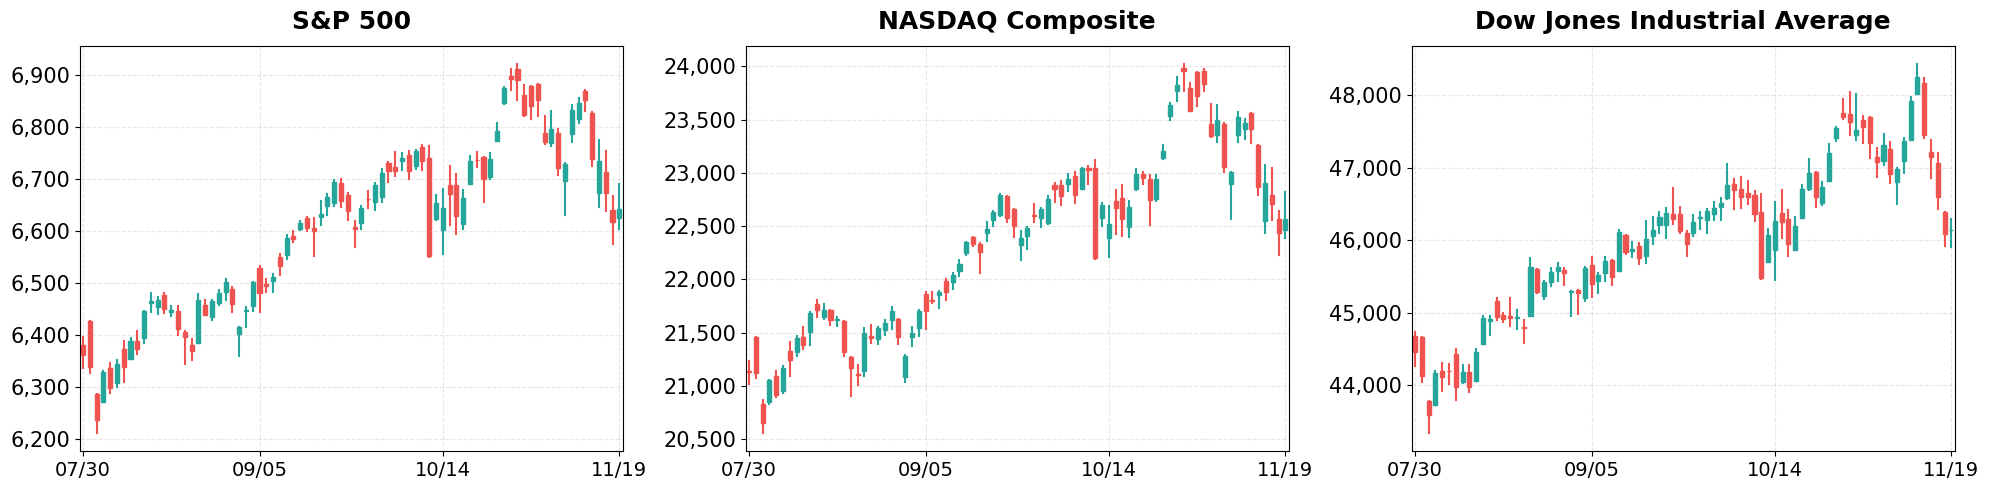
S&P 500 (+0.38%)
The benchmark advanced 0.38% to 6,642.16, adding 24.84 points, driven by strength in large‑cap financials and industrials. Volume remained moderate, suggesting the rally is supported by genuine buying rather than speculative spikes. A modest rotation from defensive utilities into cyclical consumer discretionary also contributed to the upward momentum.
NASDAQ Composite (+0.59%)
The tech‑heavy NASDAQ surged 0.59% to 22,564.23, up 131.38 points, as semiconductor makers posted better‑than‑expected guidance. The gain also reflected renewed investor appetite for growth stocks after the recent pullback. AI‑related names led the charge, pushing the index higher on optimism surrounding upcoming product launches.
Dow Jones Industrial Average (+0.10%)
The Dow Jones Industrial Average inched up 0.10% to 46,138.77, gaining 47.03 points, anchored by gains in energy and materials companies. The modest rise underscores a cautious but positive sentiment among blue‑chip investors. Higher dividend yields from several industrials added a defensive cushion to the overall performance.
Top Movers
Top Gainers
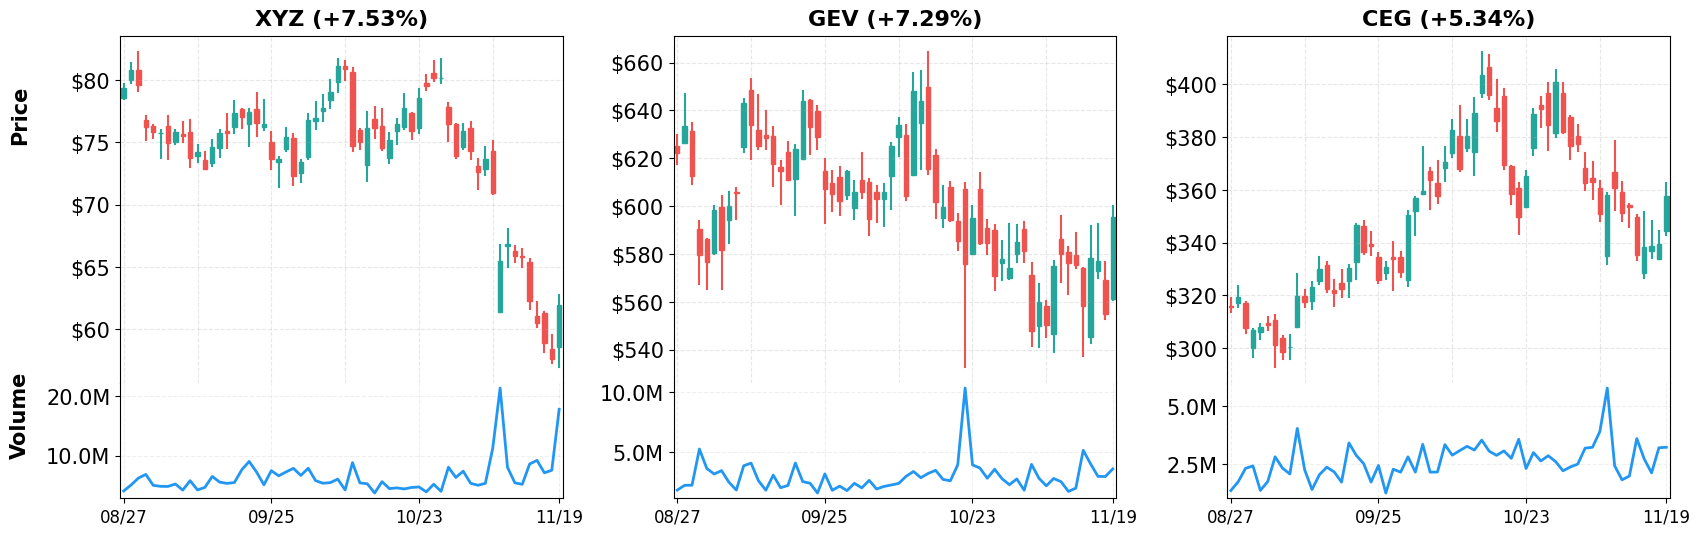
- XYZ (+7.53%)
- GEV (+7.29%)
- CEG (+5.34%)
Top Losers
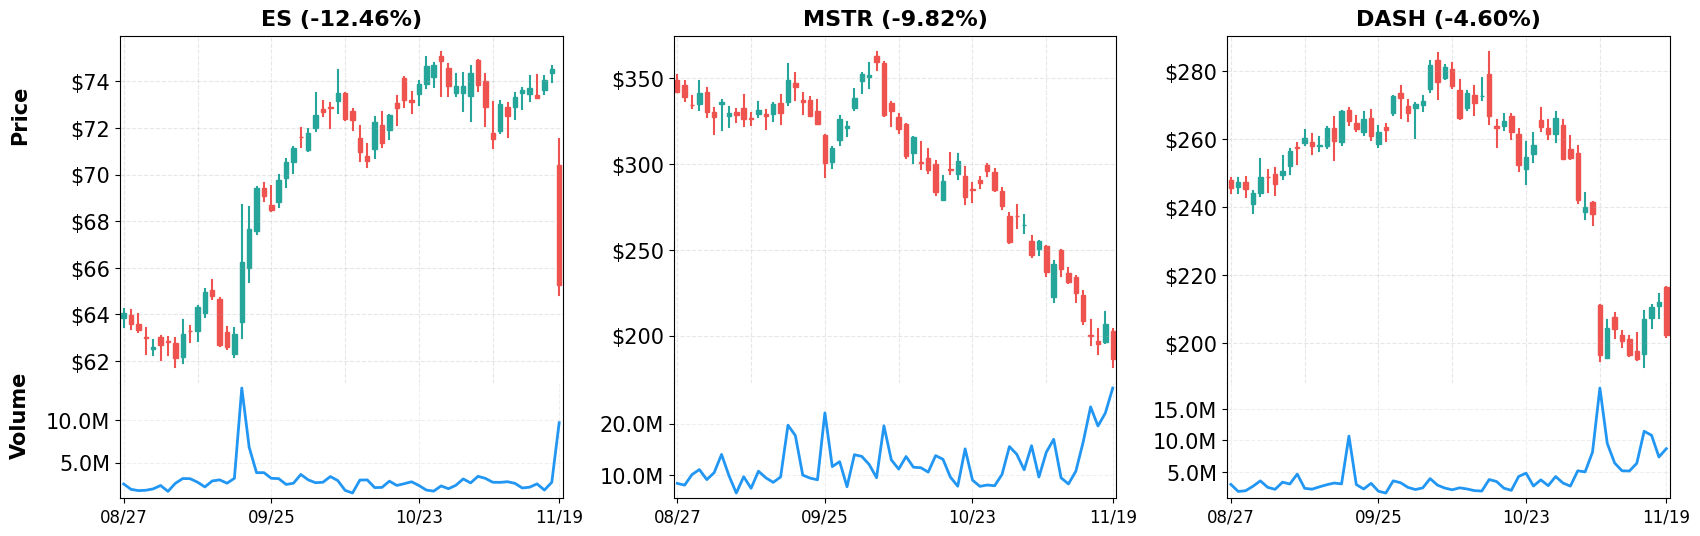
- ES (-12.46%)
- MSTR (-9.82%)
- DASH (-4.60%)
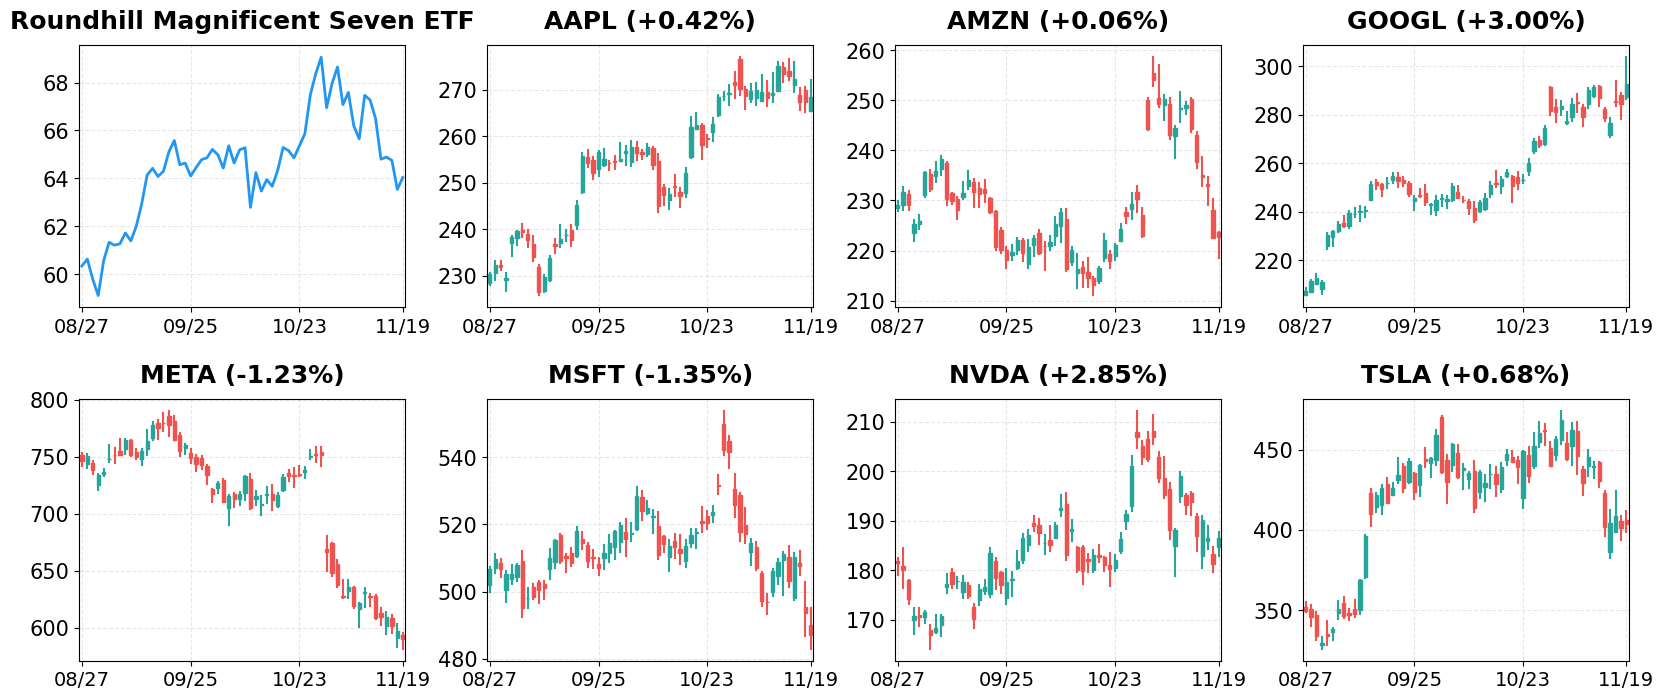
Magnificent 7
Overview
Performance Comparison: Magnificent 7 vs Major Indices
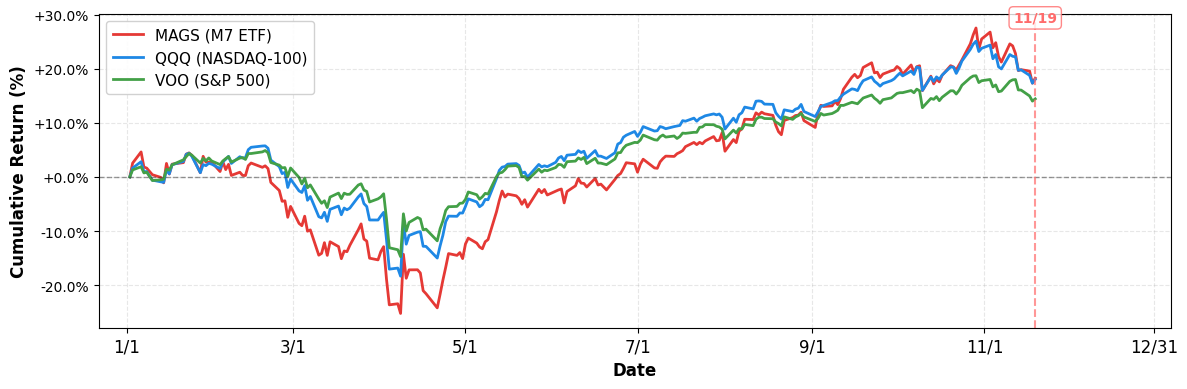
- YTD Performance:
- S&P 500 (VOO): +14.41%
- NASDAQ-100 (QQQ): +18.01%
- Magnificent 7 (MAGS): +18.23%
M7 Total Market Capitalization
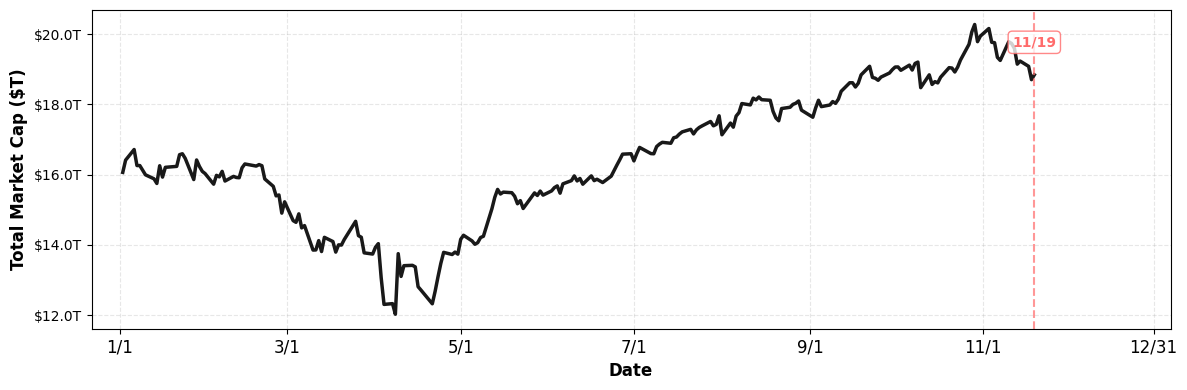
- YTD Market Cap Change:
- $16.06T (1/1) → $18.84T (current), +17.31%
1. AAPL
Price: $268.56 (+0.42%)
- Meet the Supercharged Artificial Intelligence (AI) Growth Stock That Could Join Apple, Nvidia, Alphabet, and Microsoft in the $3 Trillion Club by 2027
- Magnificent Seven Stocks: Apple, Google, Tesla Rally; Nvidia Jumps Ahead Of Earnings
- Nvidia earnings will shed a light on whether Big Tech is fueling an AI boom or bubble
2. AMZN
Price: $222.69 (+0.06%)
- Stock market today: Dow, S&P 500, Nasdaq rise as stocks pause sell-off streak before Nvidia earnings
- MP Materials gets bullish Goldman call, Plug Power stock falls
- Nvidia earnings to dictate markets’ direction
3. GOOGL
Price: $292.81 (+3.00%)
- Google’s Gemini 3 Receives Rave Reviews
- 5-star analyst revamps Google stock target on three-shot case
- S&P 500 Rallies on Alphabet Jump. Nvidia Earnings Spark Market Optimism
4. META
Price: $590.32 (-1.23%)
- Meta’s Antitrust Win Is Also a Warning for Investors
- EXCLUSIVE: ‘We Dropped Out Of Harvard And Dedicated Our Lives To Building This’—Their $349 AI With ‘Hyper-Intelligent’ Brain Rivals Meta
- Nvidia to report high-stakes Q3 earnings amid investor concerns of AI overbuilding
5. MSFT
Price: $487.12 (-1.35%)
- Saudi PIF, SITE, Microsoft sign MOU to explore delivery of sovereign-cloud services in kingdom
- Market Chatter: Microsoft CEO Names Rolf Harms as AI Reboot Advisor
- How Microsoft Leverages AI for Rapid Crisis Response
6. NVDA
Price: $186.52 (+2.85%)
- Stock market today: Dow, S&P 500, Nasdaq rise as stocks pause sell-off streak before Nvidia earnings
- US stocks break losing streak ahead of Nvidia’s earnings
- Nvidia boss meeting Saudis, xAI raising funds, Target’s earnings
7. TSLA
Price: $403.99 (+0.68%)
- MP Materials gets bullish Goldman call, Plug Power stock falls
- Nvidia boss meeting Saudis, xAI raising funds, Target’s earnings
- AMD, Intel and TSMC brace for Nvidia earnings: trending stocks
Disclaimer: This market briefing is for informational and educational purposes only and should not be considered investment advice. The information presented is based on publicly available data and represents the author’s analysis as of November 19, 2025. Stock prices are volatile and past performance does not guarantee future results. Always conduct your own research and consult with a qualified financial advisor before making investment decisions. The author may or may not hold positions in the securities discussed.

Leave a comment