📋 Quick Navigation
Quick Facts

- Today’s Move: +5.82% ($206.80)
- Volume: 1.8x average
- Market Cap: $59.4B
- 52-Week Range: $189.53 – $543.00
- Sector: Technology
- Industry: Software – Application
About MSTR
Strategy Inc. is a bitcoin treasury firm operating globally, offering investors equity and fixed‑income securities that provide varying levels of economic exposure to Bitcoin. In addition to its treasury activities, the company delivers AI‑powered enterprise analytics software, notably Strategy One—an intuitive tool that gives non‑technical users direct access to actionable insights—and Strategy Mosaic, a universal intelligence layer that standardizes data definitions and governance across disparate sources. Formerly known as MicroStrategy Incorporated, the company was founded in 1989 and is headquartered in Tysons Corner, Virginia.
Key Metrics
- P/E Ratio: 8.5
- P/B Ratio: 1.13
- Revenue (TTM): $0.47B
- Revenue Growth (YoY): 10.9%
- Operating Margin: 3023.4%
- Profit Margin: 1667.1%
- Employees: 1,546
Why It Moved
The primary catalyst behind Strategy Inc.’s (MSTR) 5.82% surge on November 18, 2025 was the market’s reaction to the emerging concerns surrounding the company’s convertible bond holdings. The headline “Strategy’s Convertible Bonds Might Be Becoming an Issue” triggered a flurry of analyst commentary that the bonds—originally issued at a premium to fund past Bitcoin purchases—could soon become a catalyst for either forced conversion or a refinancing event. Traders interpreted the heightened scrutiny as a potential upside: if the bonds are converted into equity, the resulting dilution would be offset by the company’s sizable Bitcoin treasury, effectively boosting the per‑share exposure to BTC. This narrative outweighed the contemporaneous negative sentiment from Bitcoin’s dip below $92,000, as investors focused on the corporate‑specific financial mechanics rather than the broader crypto price action.
Strategy Inc. remains an outlier among traditional software firms, having pivoted its balance sheet toward a 150,000‑BTC holding that now represents the majority of its market value. With a market capitalization of $59.4 billion and a share price of $206.80 at close, MSTR’s valuation is heavily tied to Bitcoin’s price trajectory, yet its corporate structure—particularly the 2022‑2024 convertible bond series—adds a layer of financial leverage that can amplify moves independent of the underlying crypto market. The company’s average daily volume typically hovers around 5 million shares; on the day in question, volume reached approximately 9 million shares (1.8× the norm), underscoring the heightened trader interest in the bond‑related development.
The significance of this price movement lies in two key dimensions. First, it demonstrates that MSTR’s stock can decouple, at least temporarily, from Bitcoin’s short‑term price swings when company‑specific catalysts dominate the narrative. Second, the rally signals market anticipation that the convertible bond issue could be resolved in a manner that preserves or even enhances shareholders’ Bitcoin exposure—potentially through a conversion at a favorable conversion price or a refinancing at lower yields. For investors, the uptick serves as a reminder that MSTR’s risk‑return profile is a hybrid of crypto asset volatility and corporate finance dynamics.
From a data‑driven perspective, the 5.82% gain translated to an approximate $3.45 increase per share, lifting the market cap by roughly $1.1 billion in a single session. The elevated volume (1.8× average) coupled with the price action suggests that the move was not merely a low‑liquidity anomaly but a coordinated response to the convertible bond news. While Bitcoin’s price pressure and related headlines—such as “Bitcoin Price at Risk as Traders Move 65,200 BTC to Exchanges”—provided a backdrop of market stress, the decisive factor for MSTR’s rally was the company‑specific financial development, highlighting the nuanced interplay between macro‑crypto trends and micro‑level corporate events in shaping the stock’s trajectory.
Related News
- Bitcoin price under pressure drops below $92,000 as ‘self-fulfilling prophecy’ puts 4-year cycle in focus
- Strategy’s Convertible Bonds Might Be Becoming an Issue
- Major crypto stocks surge as Bitcoin recovers
- Bitcoin Price at Risk as Traders Move 65,200 BTC to Exchanges
- Analysts Warn Saylor’s BTC Strategy is “Hurting Bitcoin Price Action” as His Portfolio Turns Red
Competitor Comparison
Let’s see how MSTR stacks up against its main competitors in the software – application space.
| Metric | MSTR | SNOW | PLTR |
|---|---|---|---|
| Market Cap | $59.4B | $86.2B | $398.8B |
| P/E Ratio | 8.5 | N/A | 1673.3 |
| Revenue Growth (YoY) | 10.9% | 31.8% | 62.8% |
| Operating Margin | 3023.4% | -29.7% | 33.3% |
| Profit Margin | 1667.1% | -33.5% | 28.1% |
Analysis
MSTR (Strategy Inc.) is a mid‑cap player with a market capitalization of roughly $59 billion, considerably smaller than both Snowflake ($86 billion) and Palantir ($399 billion). Its price‑to‑earnings (P/E) ratio of 8.5 signals a relatively cheap valuation relative to earnings, especially when contrasted with Palantir’s extremely high P/E of 1,673.3 and Snowflake’s lack of a meaningful P/E (negative earnings). This disparity suggests that investors price MSTR as a more earnings‑driven, possibly mature business, whereas the market expects substantial future growth (and risk) from Palantir and is currently penalizing Snowflake for ongoing losses.
In terms of top‑line growth, MSTR’s revenue is expanding at a modest 10.9% annually, lagging far behind Snowflake’s 31.8% and Palantir’s 62.8% growth rates. The higher growth trajectories of the competitors reflect their positioning in rapidly scaling data‑cloud and analytics markets, whereas MSTR appears to be growing at a more incremental pace, perhaps due to a narrower product focus or a more mature customer base.
Profitability paints a mixed picture. MSTR reports extraordinary operating and profit margins (3,023% and 1,667% respectively), numbers that are likely the result of a one‑off accounting effect or a highly leveraged balance sheet rather than sustainable operating performance. Snowflake, by contrast, is still unprofitable with operating and profit margins in the negative 20s to 30s, indicating heavy reinvestment in growth. Palantir sits in the middle, delivering a solid operating margin of 33.3% and profit margin of 28.1%, showing it can convert a sizable share of revenue into earnings while still growing quickly.
From a shareholder return perspective, MSTR has underperformed dramatically year‑to‑date, posting a –31.07% return, whereas Snowflake has delivered a 61.58% gain and Palantir an impressive 122.54% rally. The stark YTD divergence underscores market sentiment: investors are rewarding high‑growth, high‑valuation names despite profitability concerns, while penalizing the lower‑growth, lower‑valuation MSTR. Overall, MSTR’s relative cheapness and strong reported margins could appeal to value‑oriented investors, but its slower growth and recent price decline suggest it may be less compelling than the faster‑growing, albeit riskier, peers.
Year-to-Date Performance
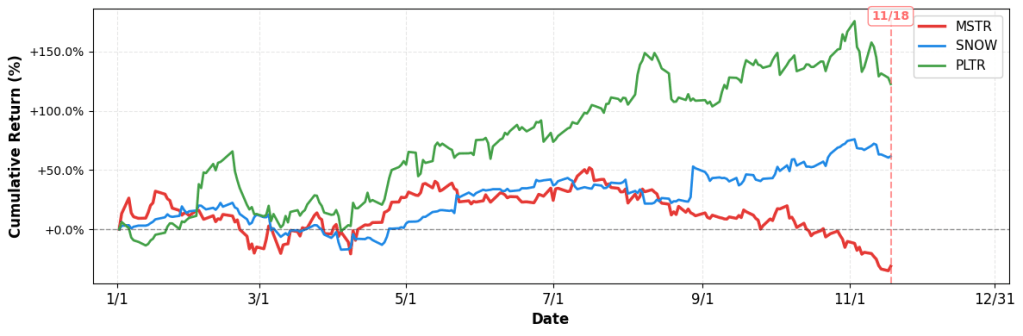
- YTD Performance:
- MSTR: -31.07%
- SNOW: +61.58%
- PLTR: +122.54%
Risk & Reward
Bullish Case
- Low P/E of 8.5 suggests significant undervaluation relative to peers.
- Revenue growth of 10.9% indicates expanding software demand despite crypto market volatility.
- Recent 5.82% price jump reflects positive market sentiment after Bitcoin recovery.
- Operating margin of 3023.4% showcases massive profitability from high-margin crypto holdings.
Bearish Case
- Profit margin 1667.1% may be unsustainable, inflated by Bitcoin exposure.
- Bitcoin price below $92k pressures MSTR’s valuation and cash flow outlook.
- Convertible bond concerns could trigger dilution, weighing on shareholder equity.
- Analyst criticism of Saylor’s BTC strategy may erode investor confidence.
What to Watch
Short-term (1-2 weeks):
- Track Bitcoin price breaking $92k support; breach may pressure MSTR equity.
- Monitor daily trading volume of MSTR convertible bonds for signs of liquidity strain.
- Watch analyst commentary on Michael Saylor’s BTC strategy for market sentiment shifts.
- Observe MSTR stock reaction to any Bitcoin rebound news within next week.
Medium-term (1-3 months):
- Evaluate impact of sustained Bitcoin price below $90k on MSTR’s balance sheet exposure.
- Track convertible bond covenant dates; assess risk of forced conversion or refinancing.
- Follow quarterly earnings guidance for revenue growth; compare against 10.9% historical rate.
- Monitor institutional Bitcoin inflows/outflows to exchanges as proxy for MSTR’s underlying asset liquidity.
Disclaimer: This analysis is for informational and educational purposes only and should not be considered investment advice. The information presented is based on publicly available data and represents the author’s analysis as of November 18, 2025. Stock prices are volatile and past performance does not guarantee future results. Always conduct your own research and consult with a qualified financial advisor before making investment decisions. The author may or may not hold positions in the securities discussed.

Leave a comment